Key takeaways
Most flowcharts rely on just eight common symbols, so you can map a clear process without memorizing the full library.
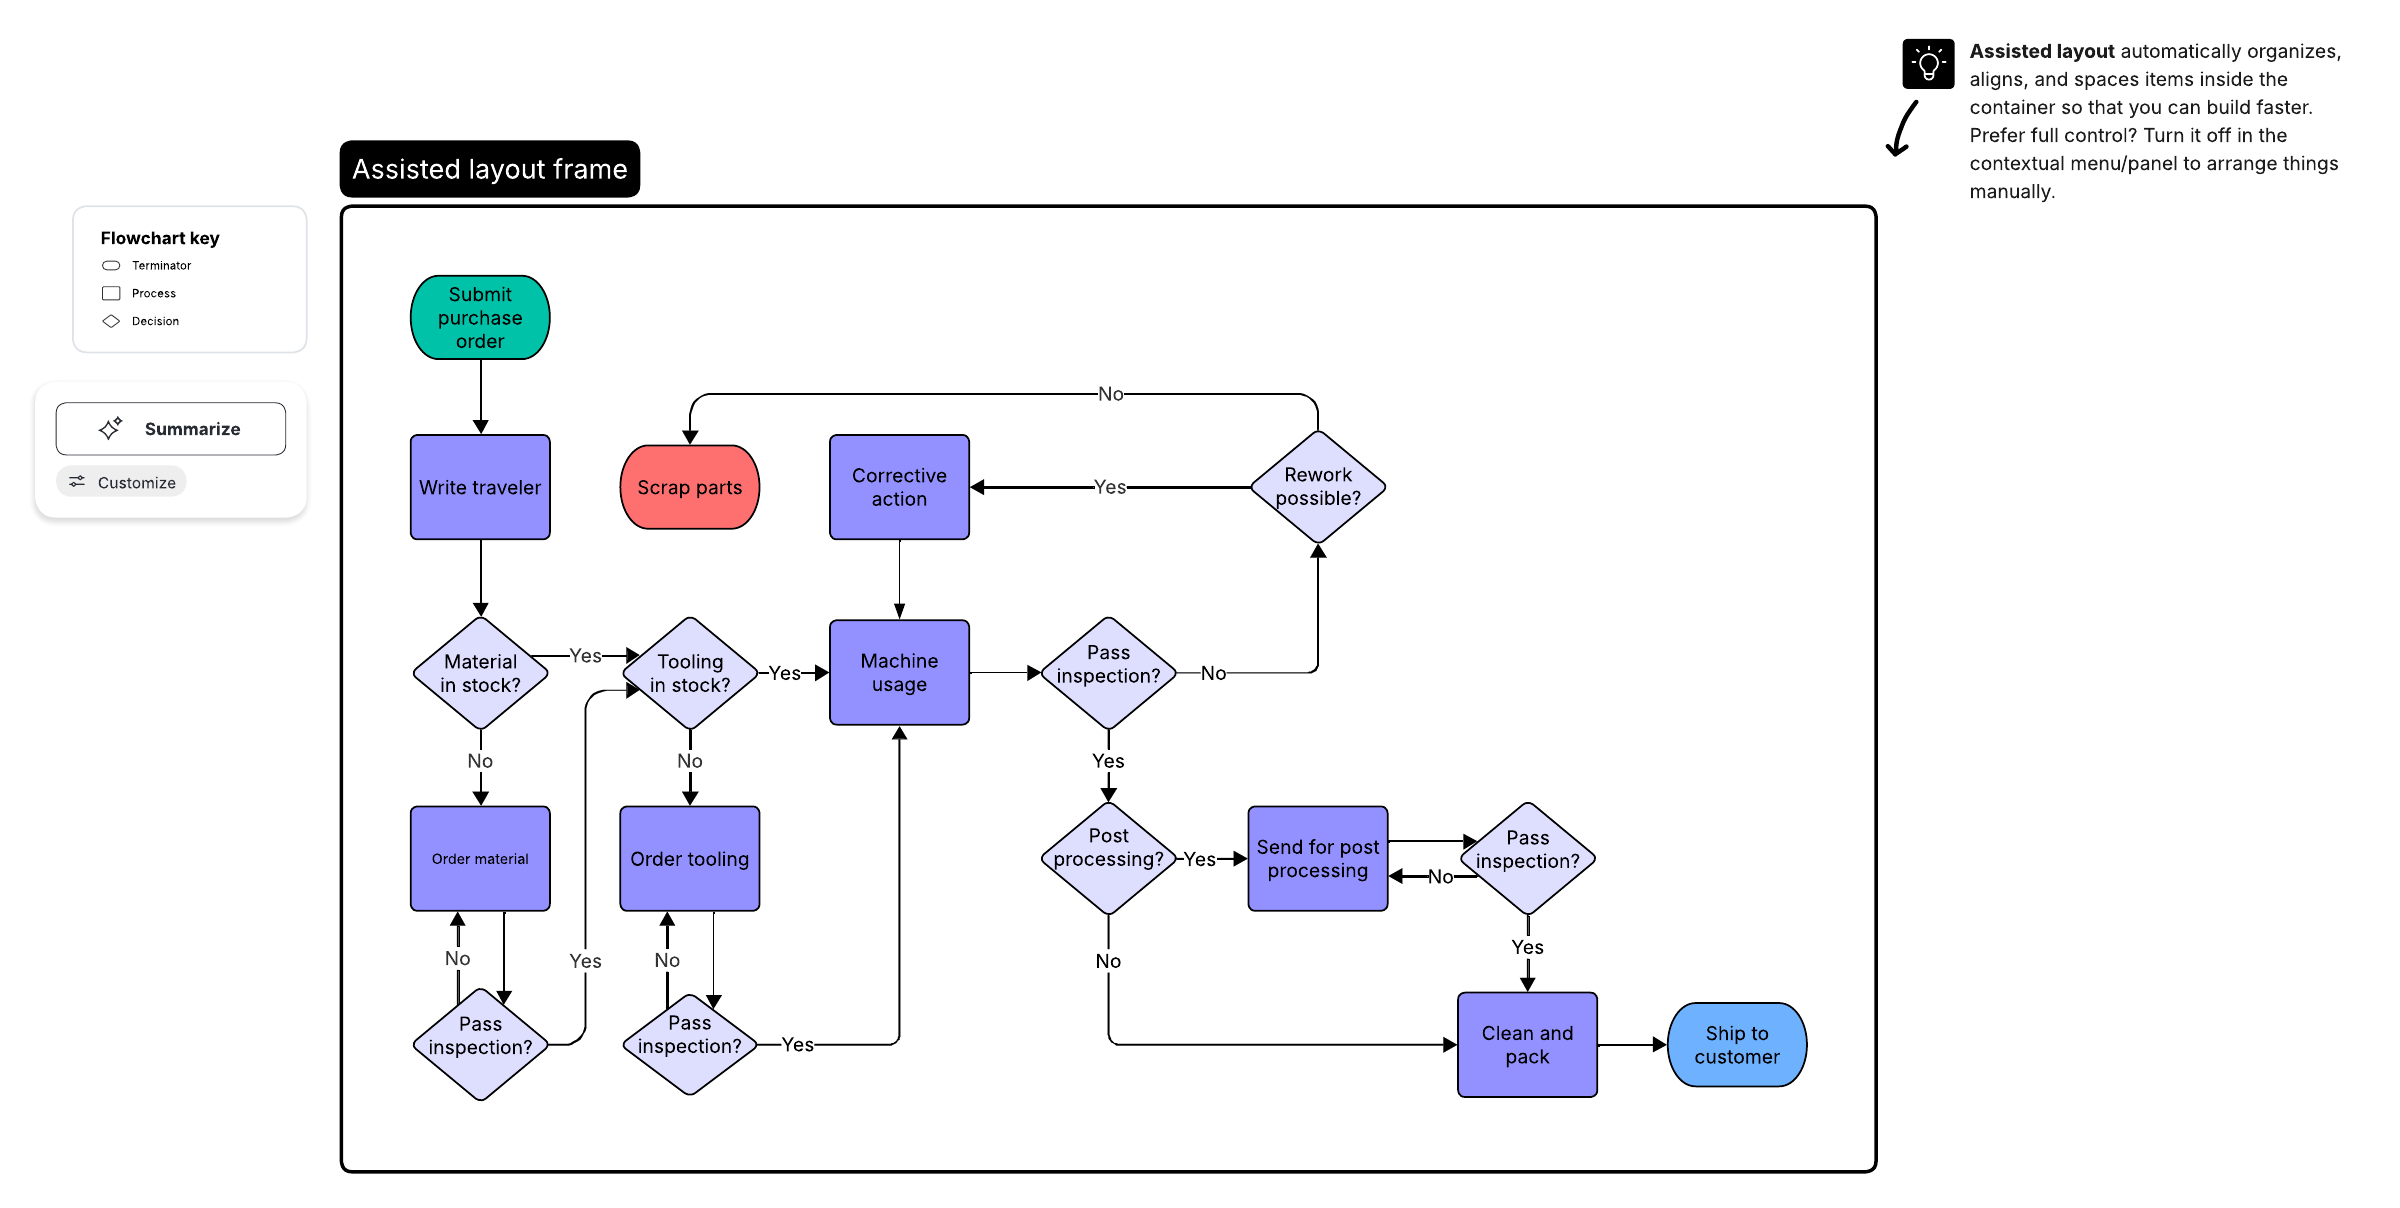
The rectangle (process symbol) is the most widely used flowchart symbol and represents any action, process, or function in your flow.
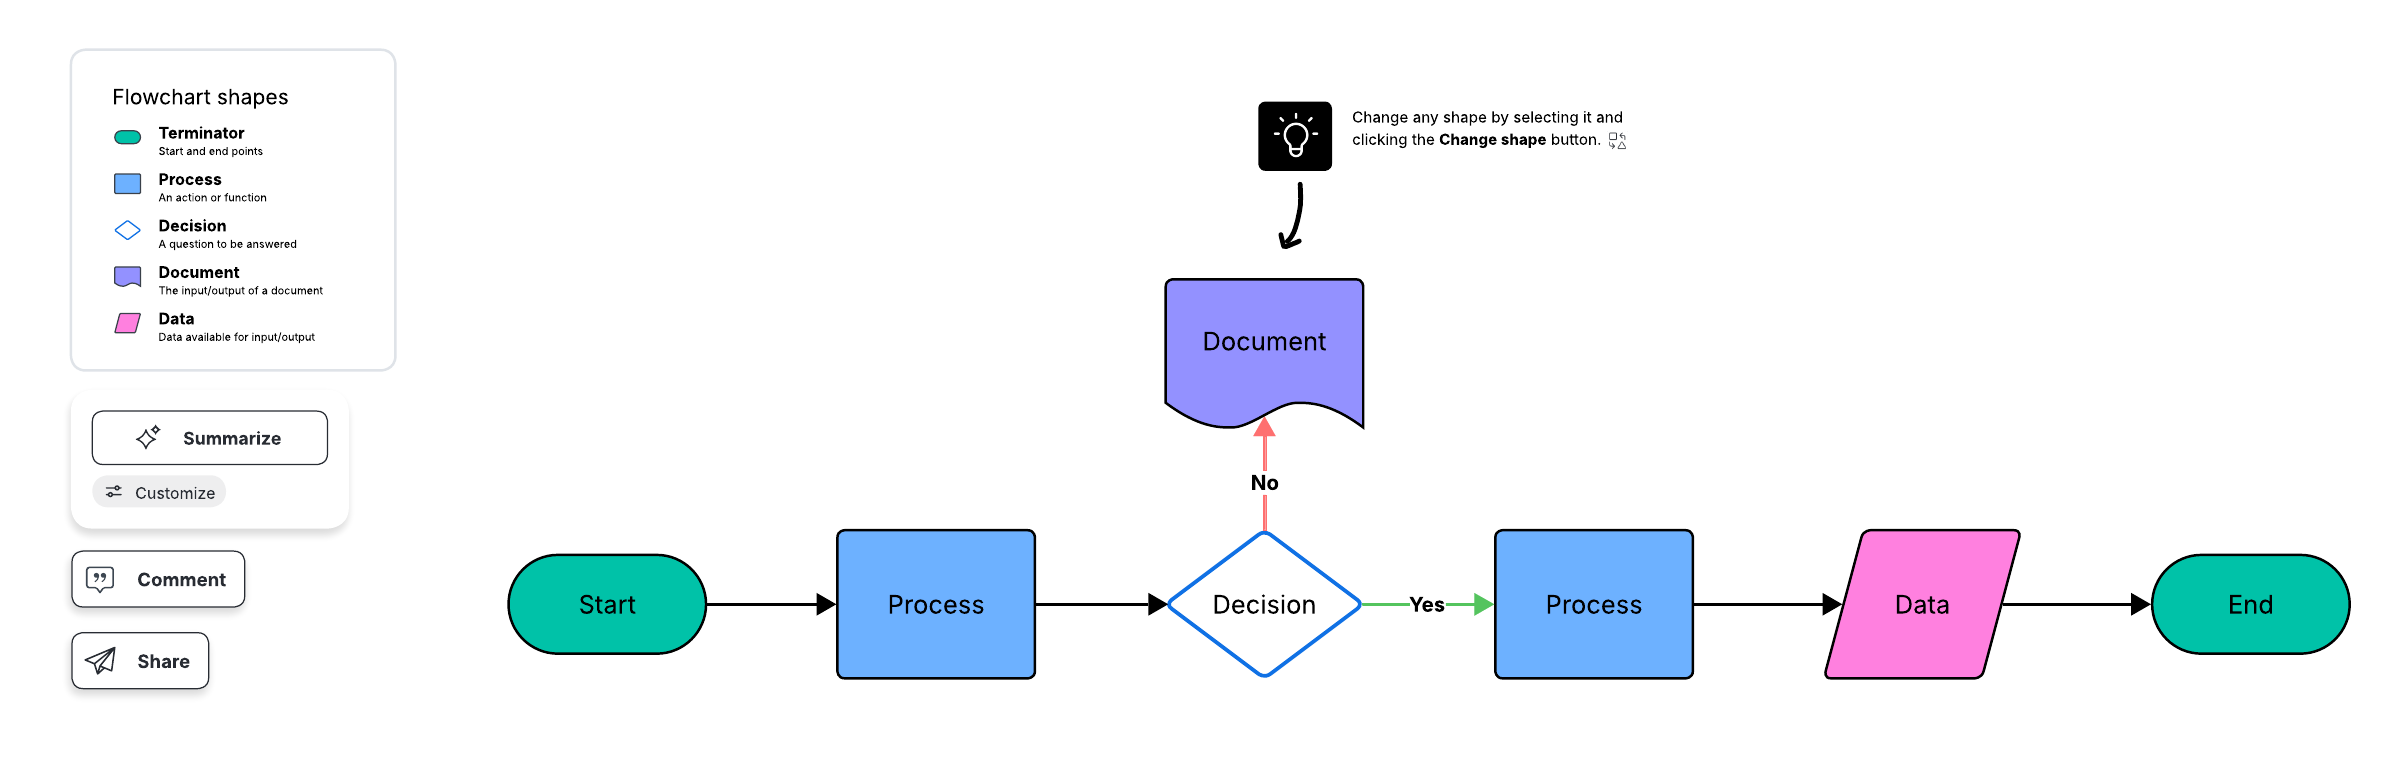
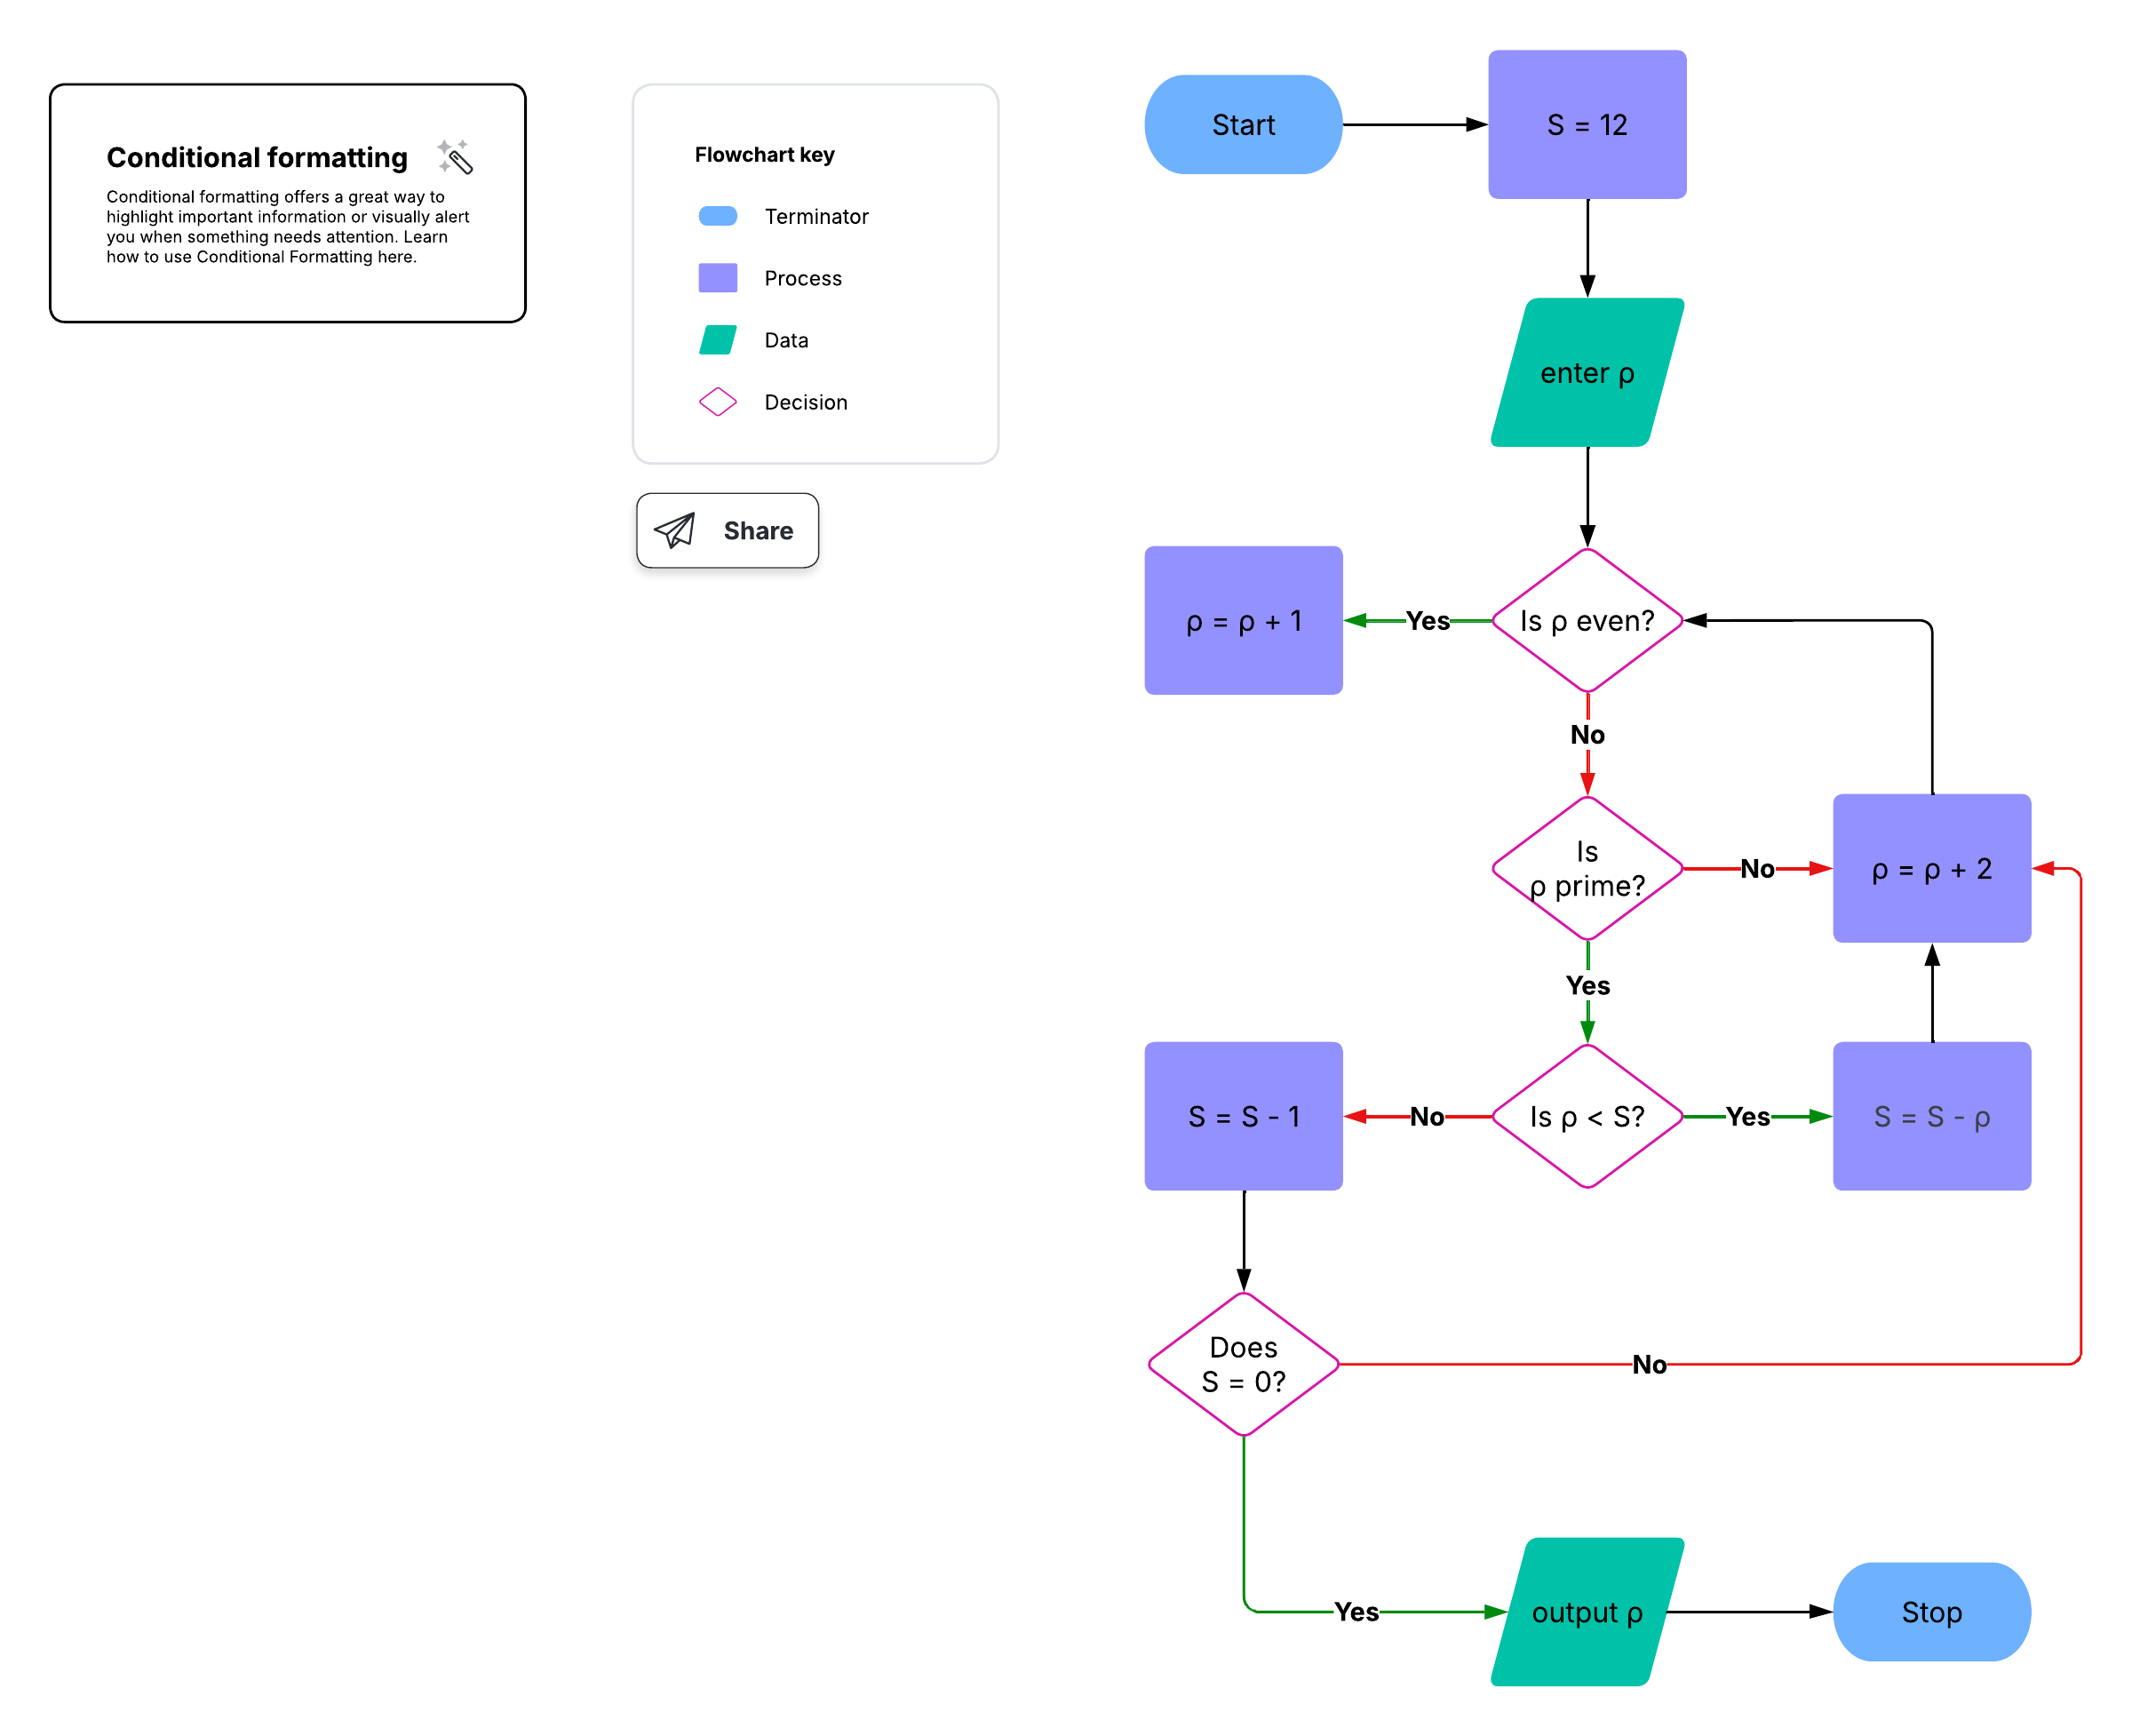
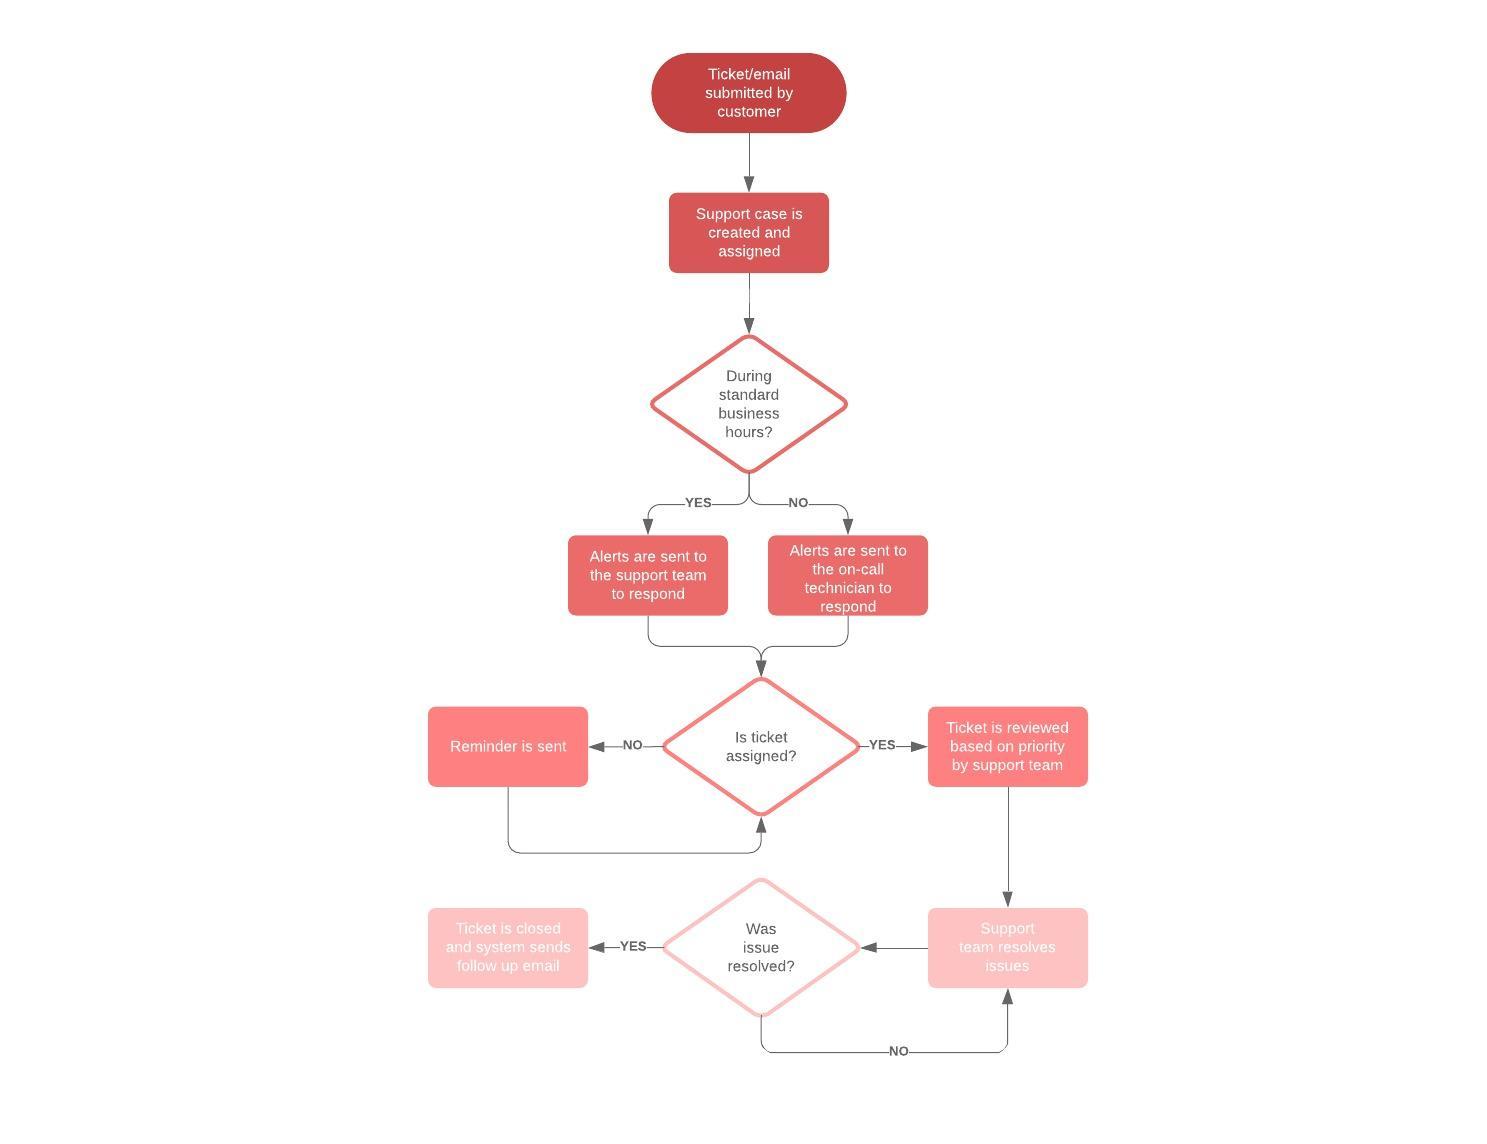
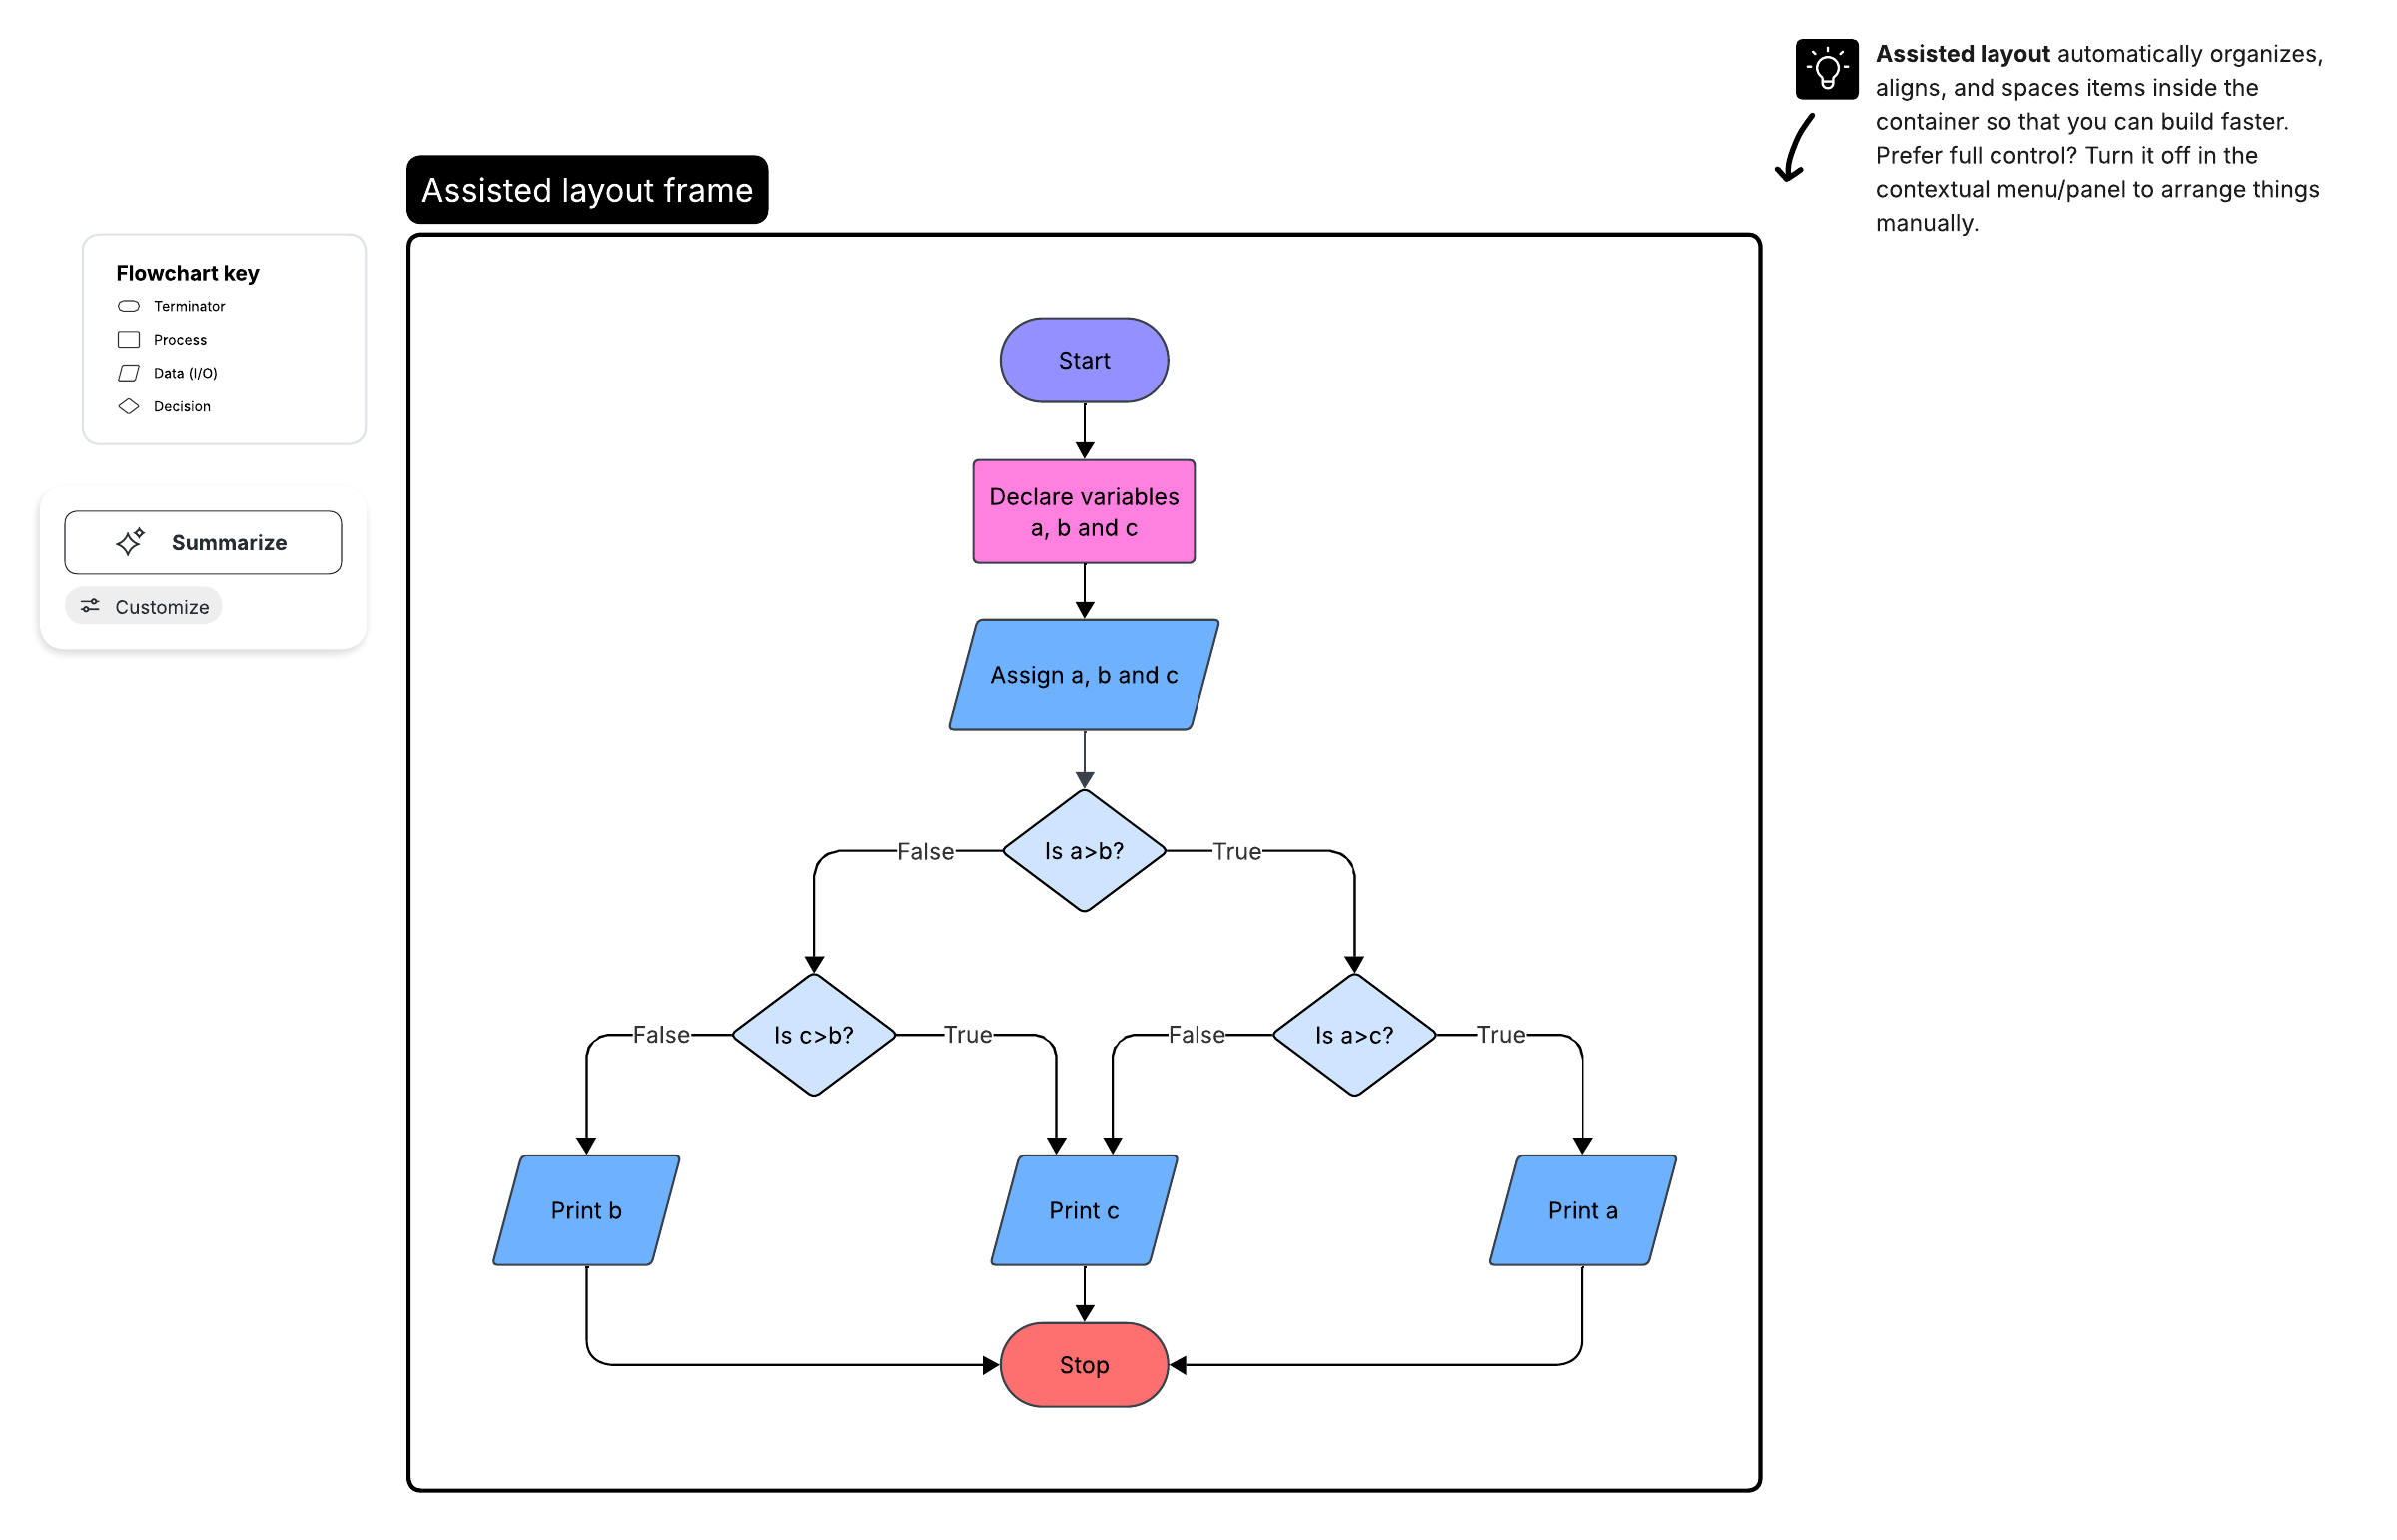
The oval marks start and end points, while the diamond poses a yes/no or true/false question that branches the path.
Additional symbols like database, manual input, and predefined process shapes help you map software, data, and user flows in detail.
You can drag, drop, and connect standard shapes in Lucidchart, or upload your own symbol.
Flowcharts use many different shapes, but most rely on just a handful of common flowchart symbols. Each symbol carries a specific meaning so that readers can follow a process at a glance. Once you learn what the core shapes represent, you can read almost any flowchart and start mapping with the Lucidchart flowchart maker.
What are the most common flowchart symbols?
The most common flowchart symbols are the process (rectangle), start/end (oval), and decision (diamond) shapes. Together with a few data and connector symbols, they cover most everyday charts. See a full breakdown in our flowchart tutorial.
Process symbol
The process symbol, also called the action symbol, is represented by a rectangle shape. It represents a process, action, or function. It is the most widely used flowchart symbol.

Terminal/terminator symbol
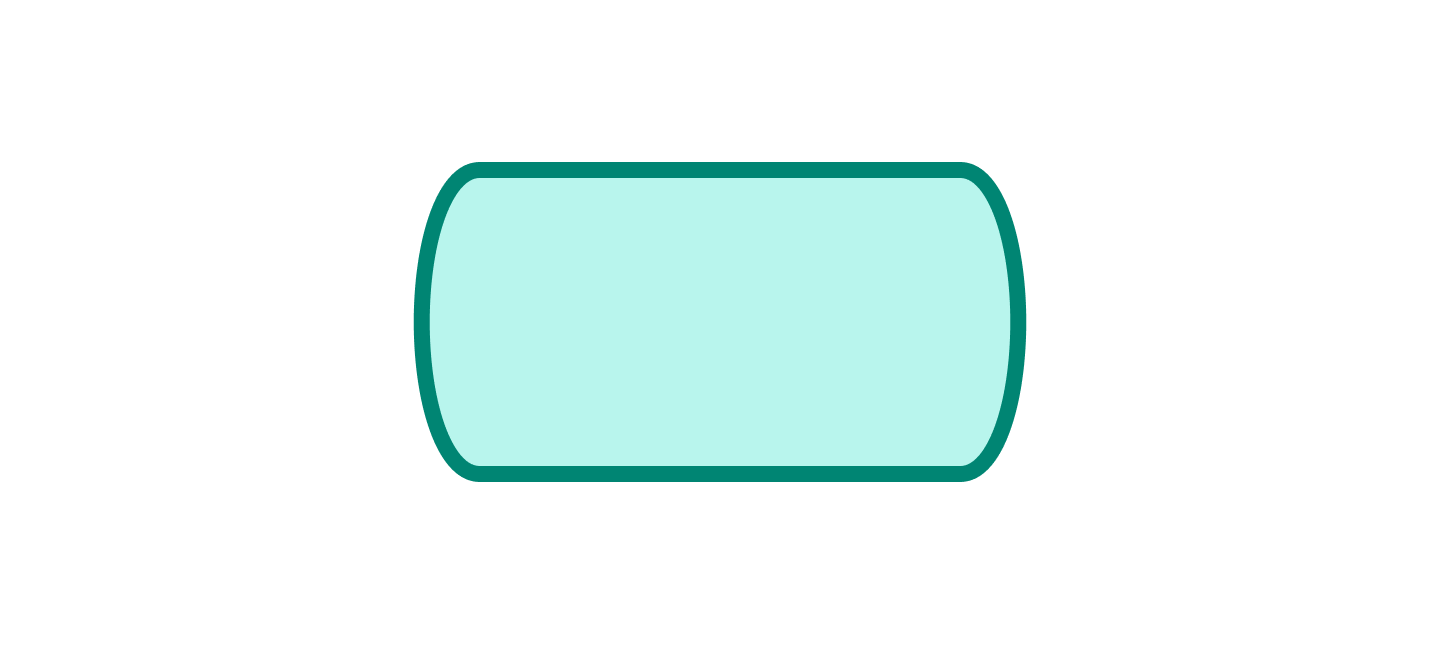
The terminal/terminator symbol is represented by either an oval or a rounded rectangle. Sometimes called the start/end symbol, it marks the start and end points, as well as the outcomes, of a path.
Decision symbol
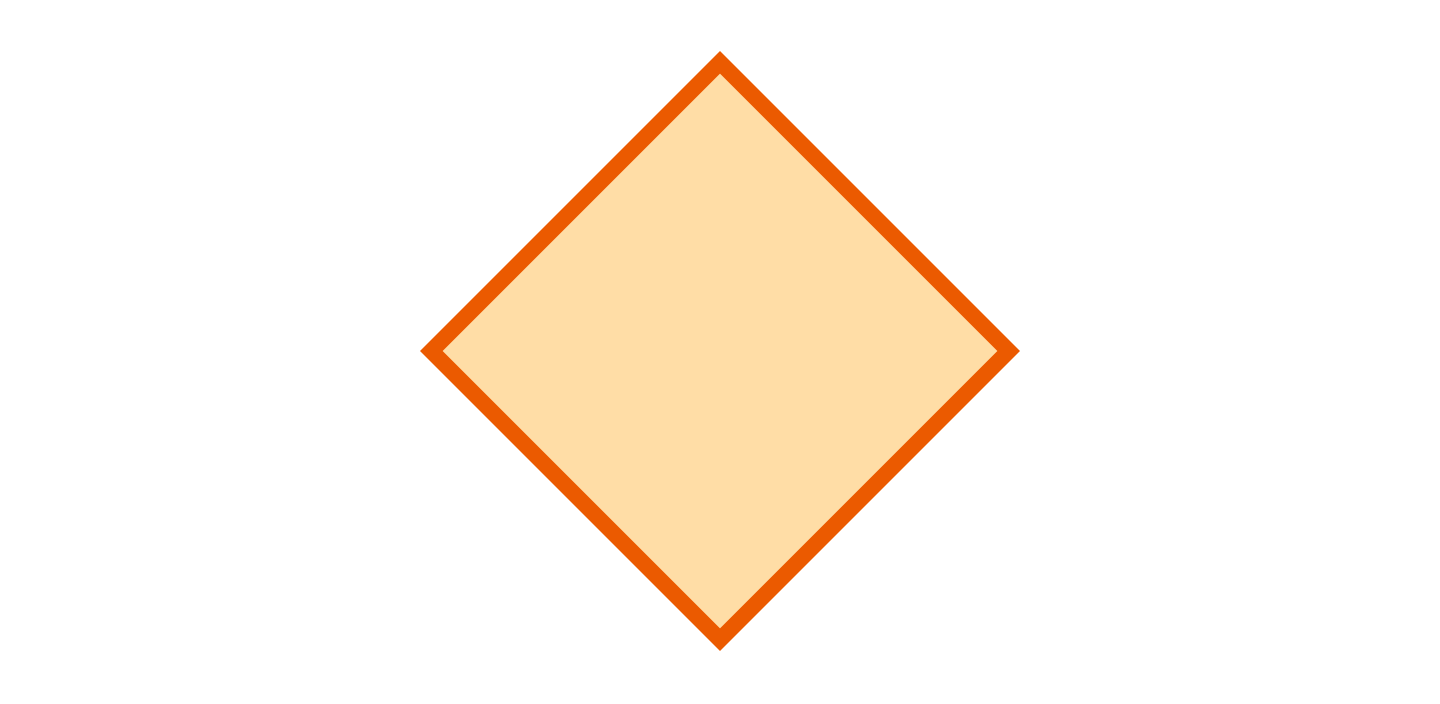
The decision symbol is represented by a diamond shape. It indicates that there is a question to answer, usually with a yes/no or true/false answer, that splits the path into branches.
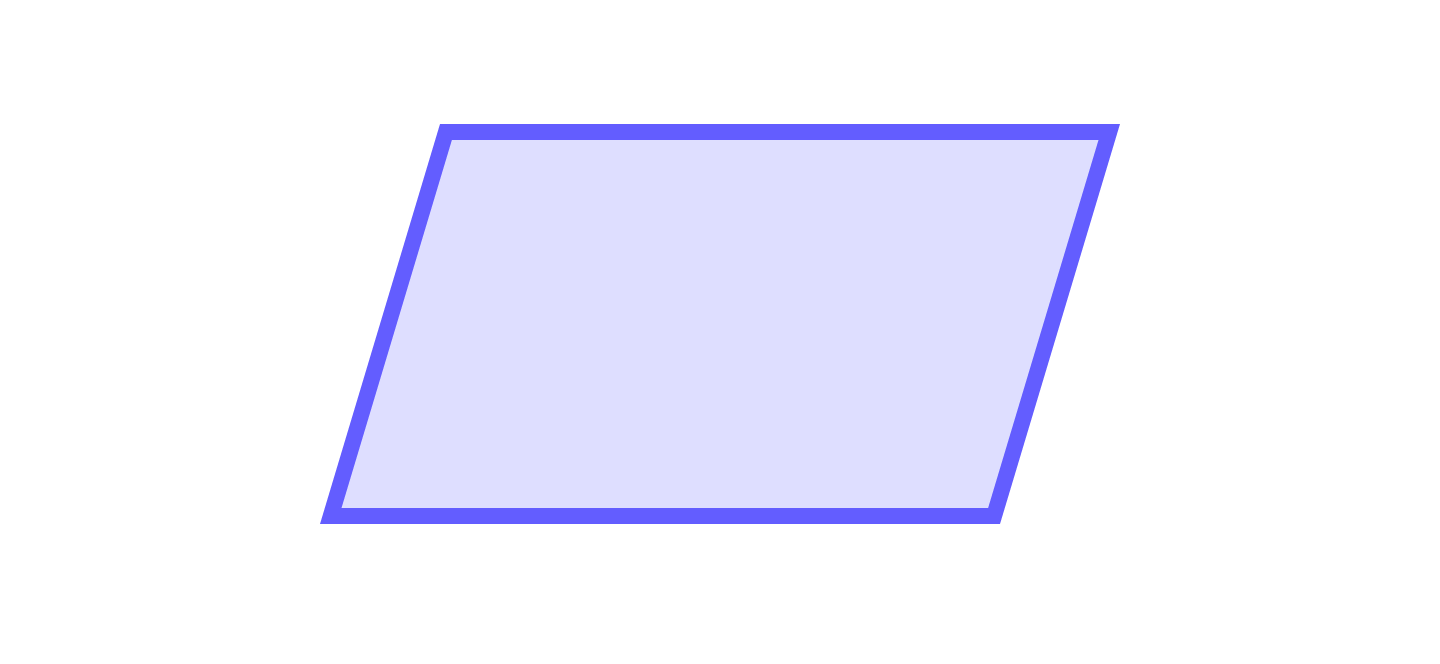
Input/output symbol
The input/output symbol indicates that data is available and that resources are used or generated. It is represented by a parallelogram shape.
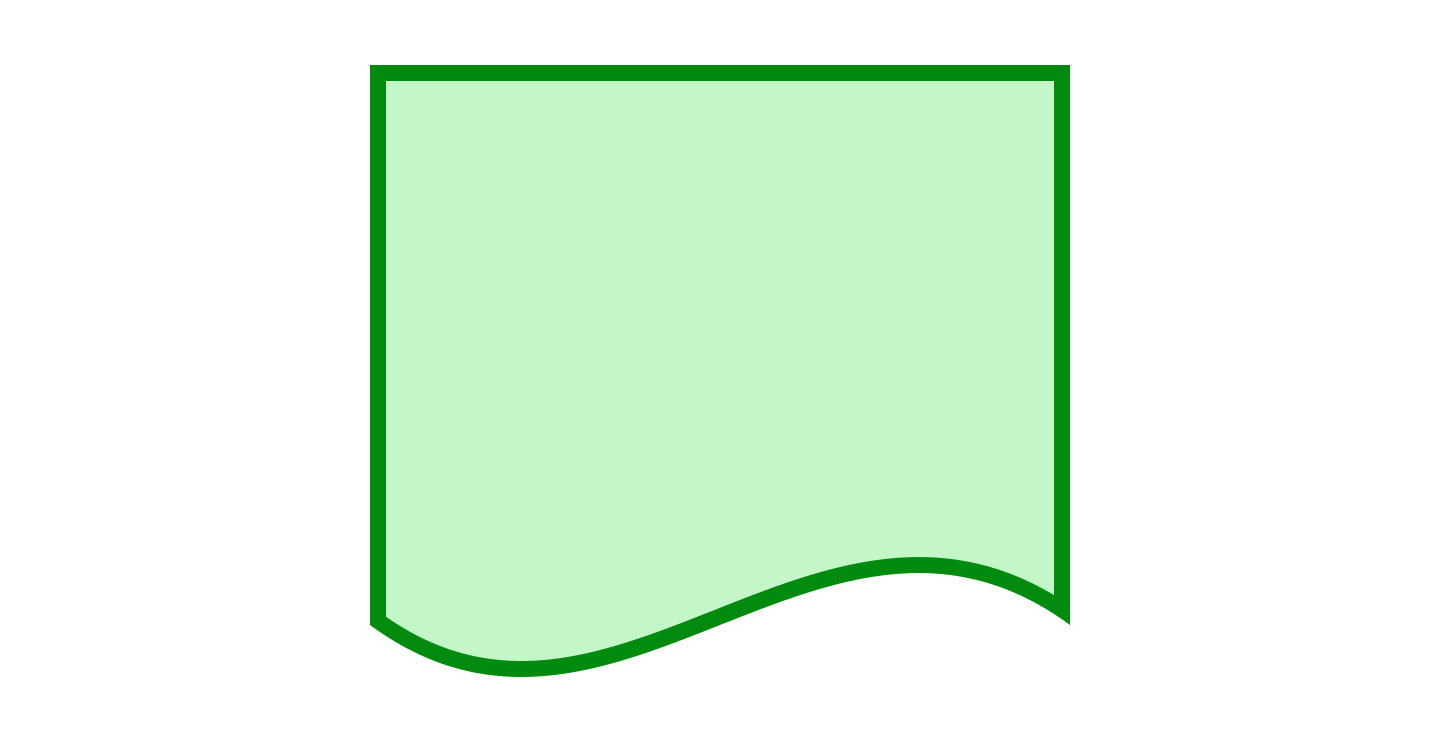
Document symbol
A document symbol, represented by a rectangle with a wavy bottom, indicates the input or output of a document, such as a report, email, or memo.
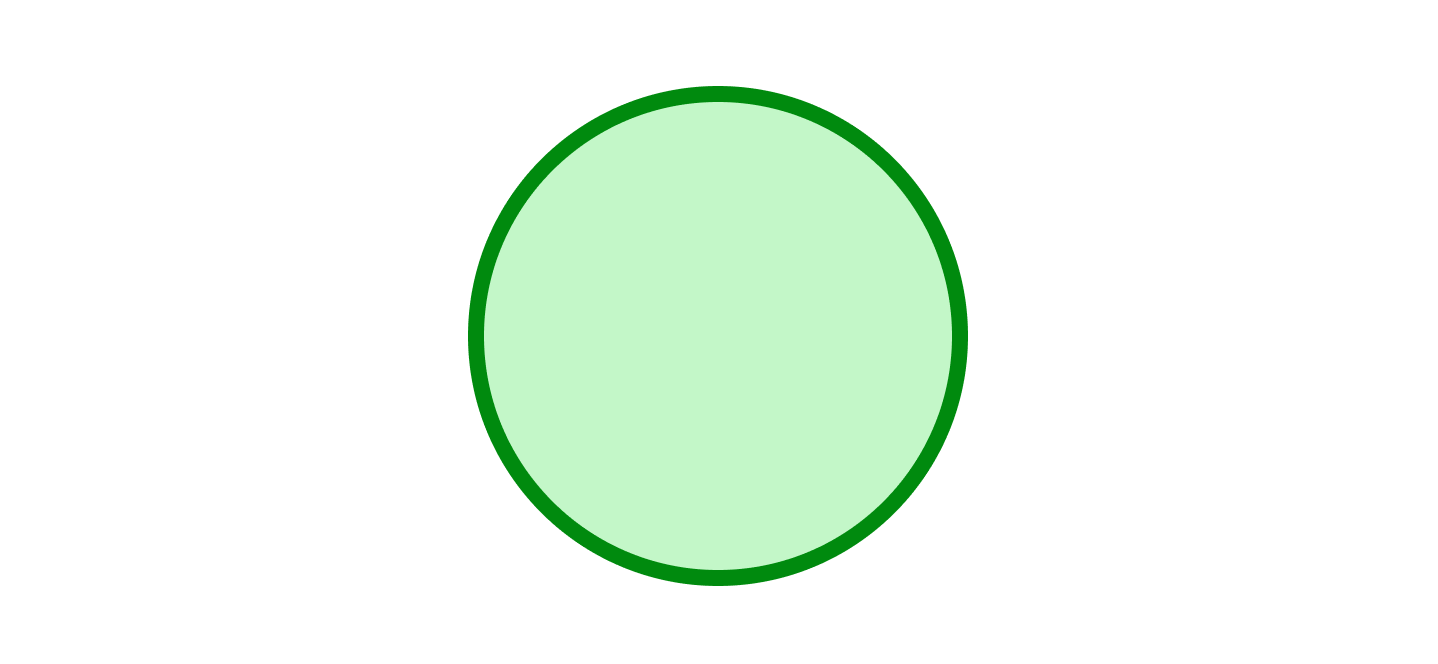
Connector symbol
A connector symbol is represented by a small circle. It connects separate elements across a single page in complex charts.
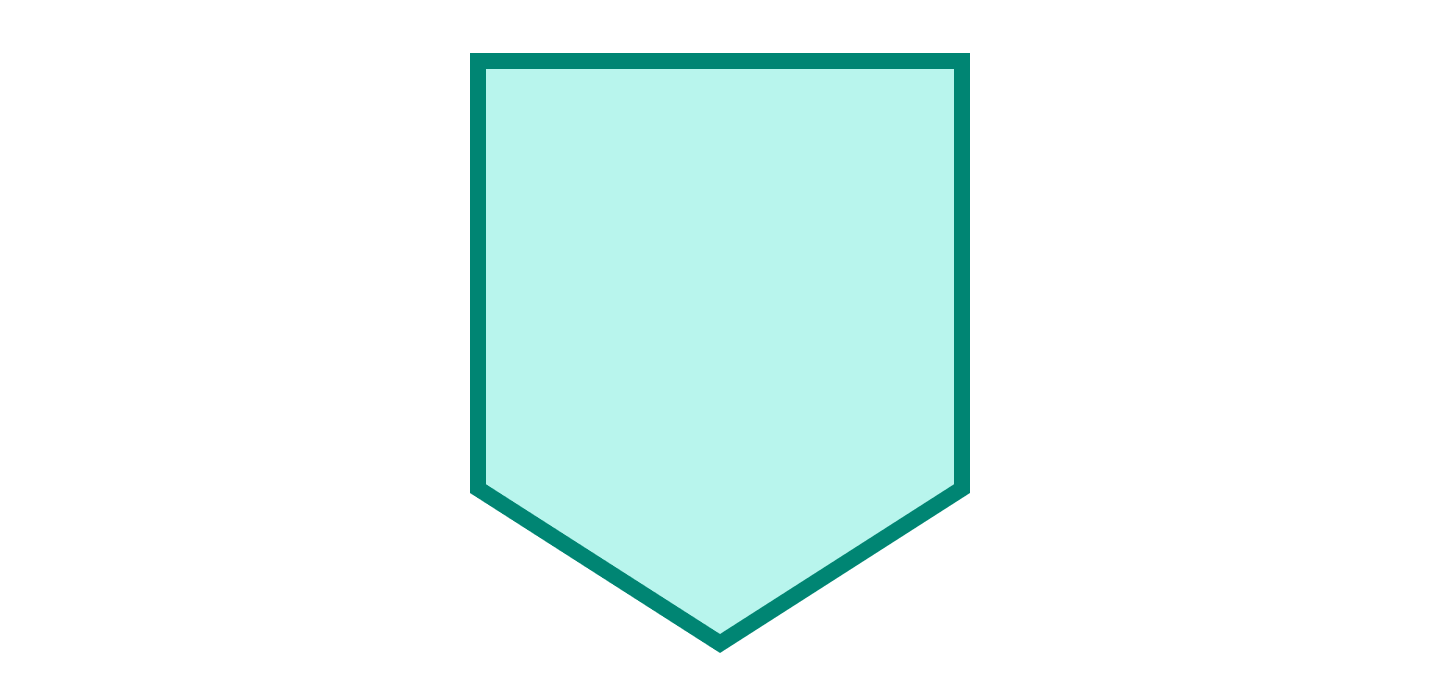
Off-page connector symbol
The off-page connector symbol is a pentagon. It connects separate elements across a single page in complex charts.
Comment/note symbol
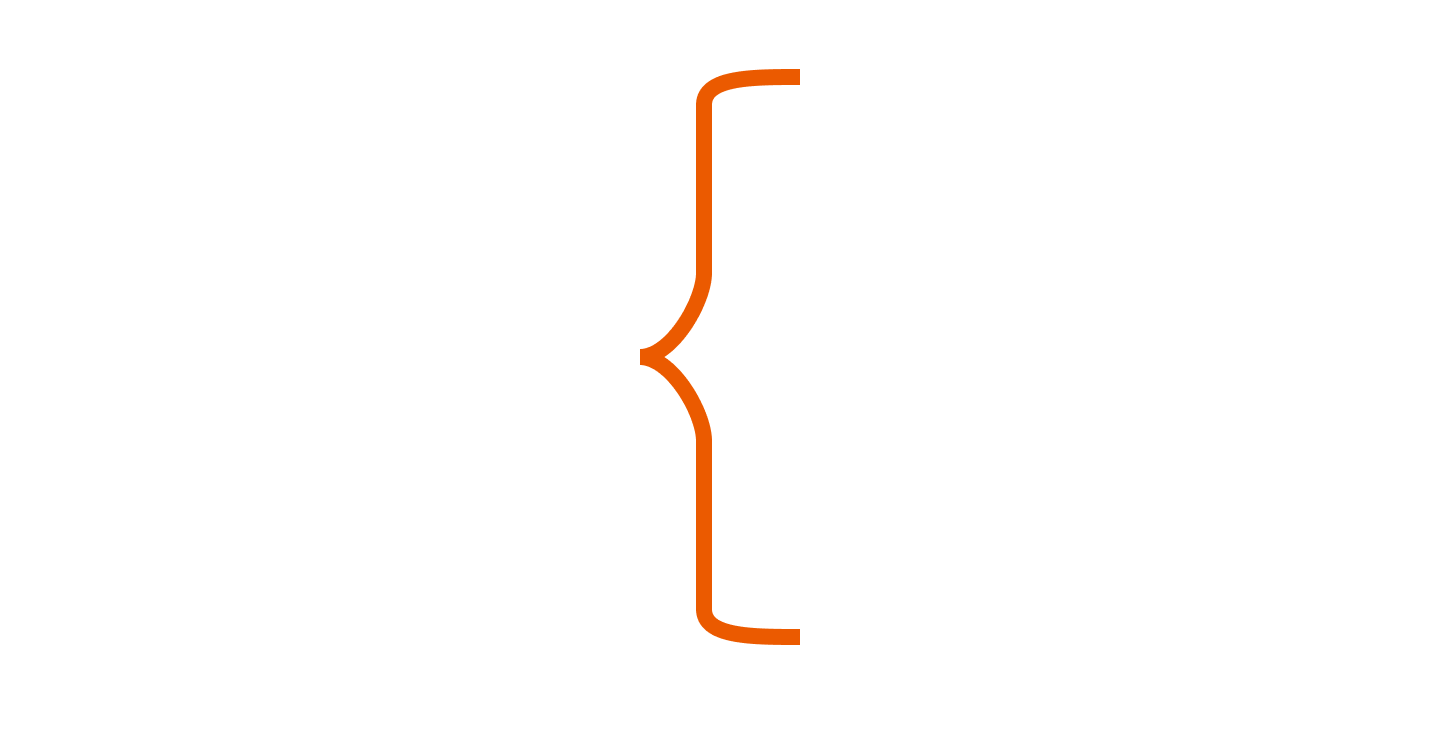
The comment or note symbol is depicted with a bracket. These add comments or further explanation, often linked to the relevant section with a dashed line.
What are the additional flowchart symbols?
These extra symbols help when you map app flows, user flows, data processing, and programming logic. You can generate one fast with our AI flowchart generator.
Database symbol
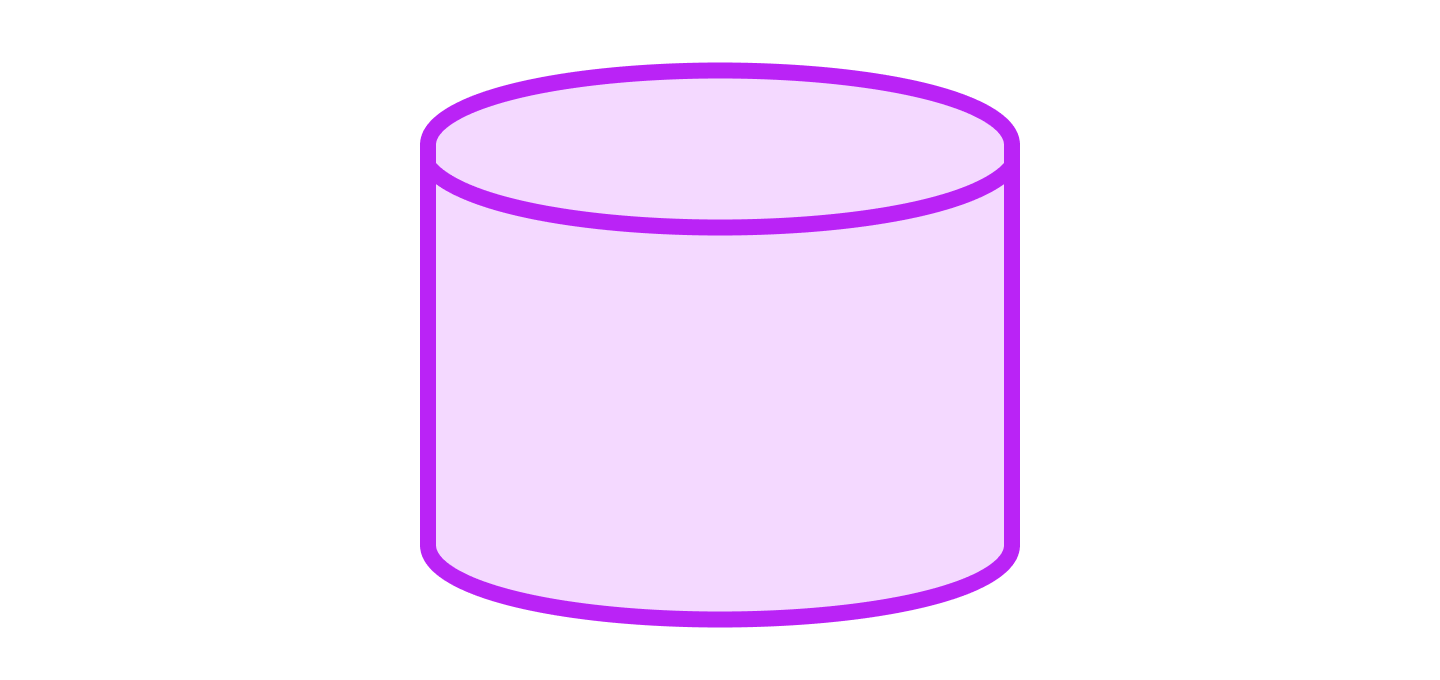
A database symbol represents data stored in a service that users can search and filter.
Stored data symbol
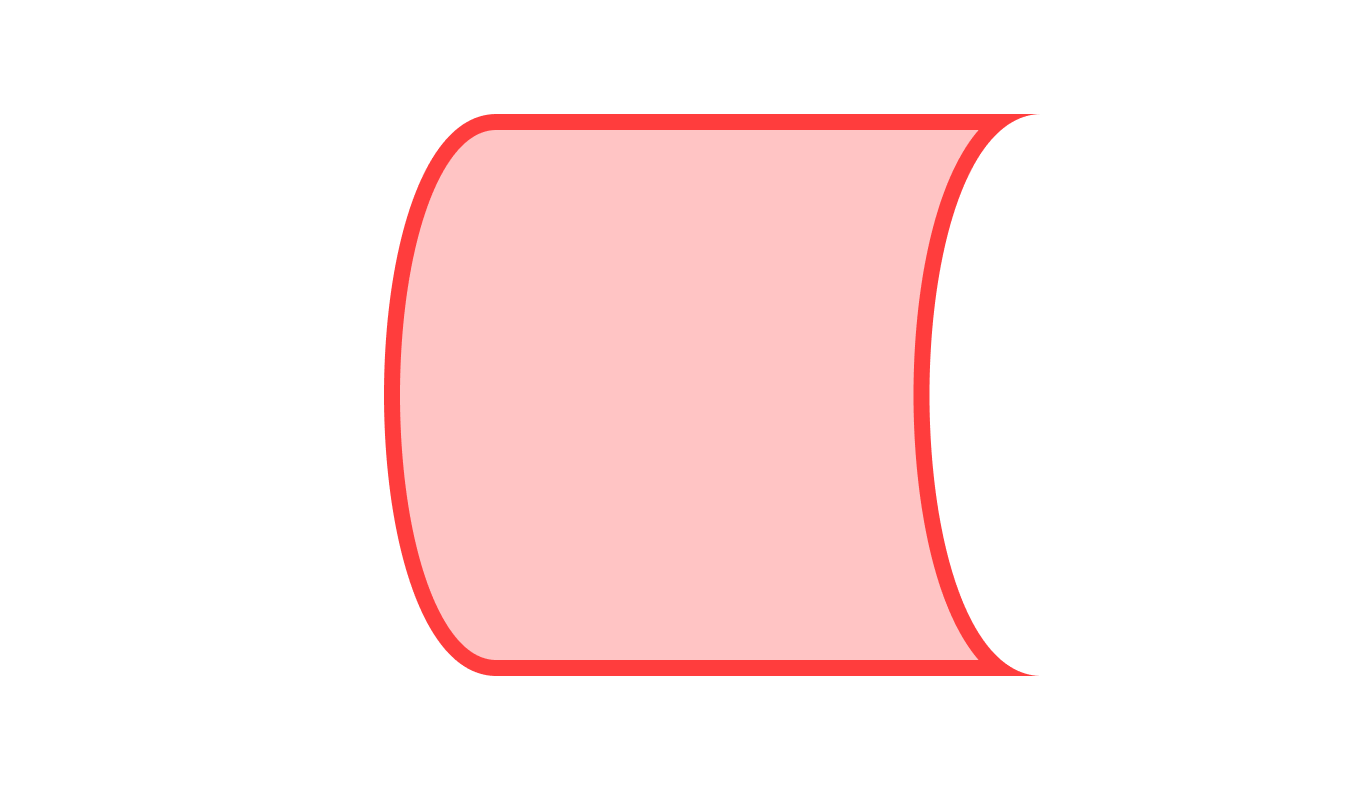
The stored data symbol indicates where data is stored within a process.
Internal storage symbol
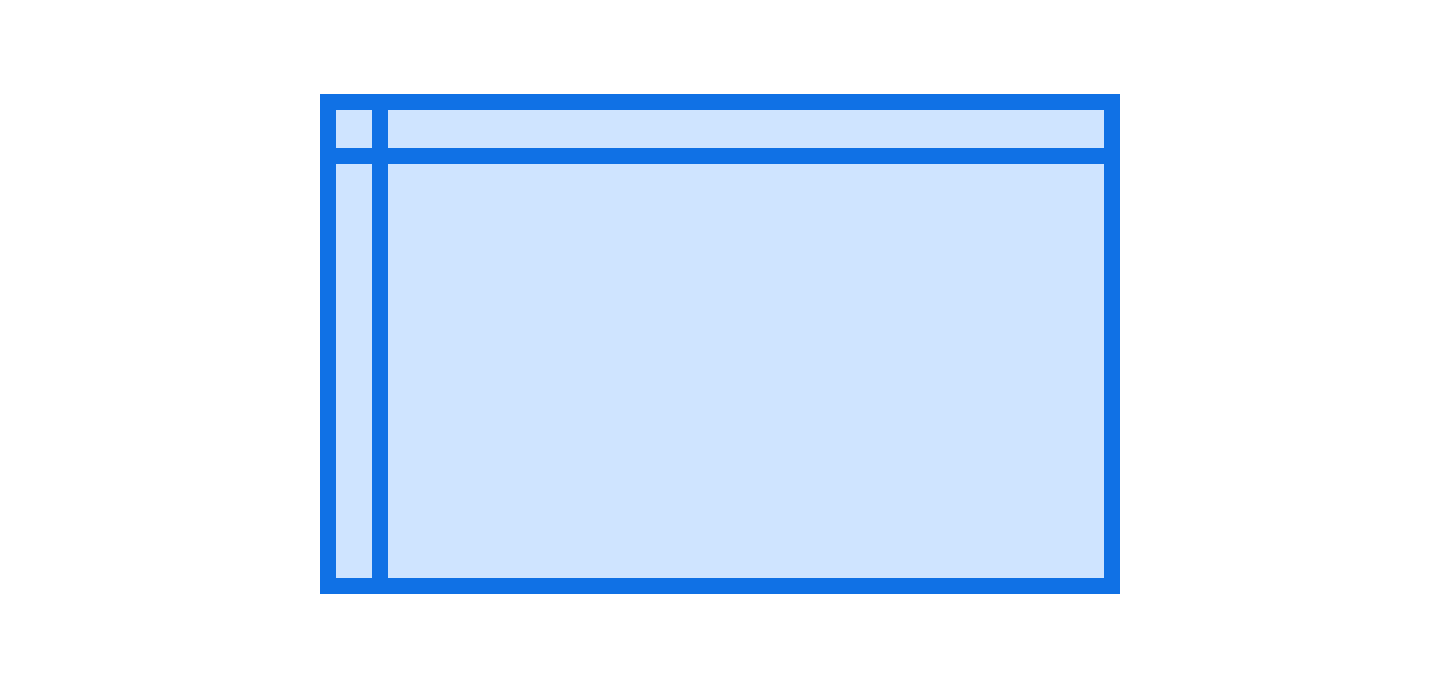
Internal storage symbols indicate that data is stored in internal memory. This symbol is very common in software design.
Hard disk symbol
The hard disk symbol indicates data on a hard drive or direct-access storage.
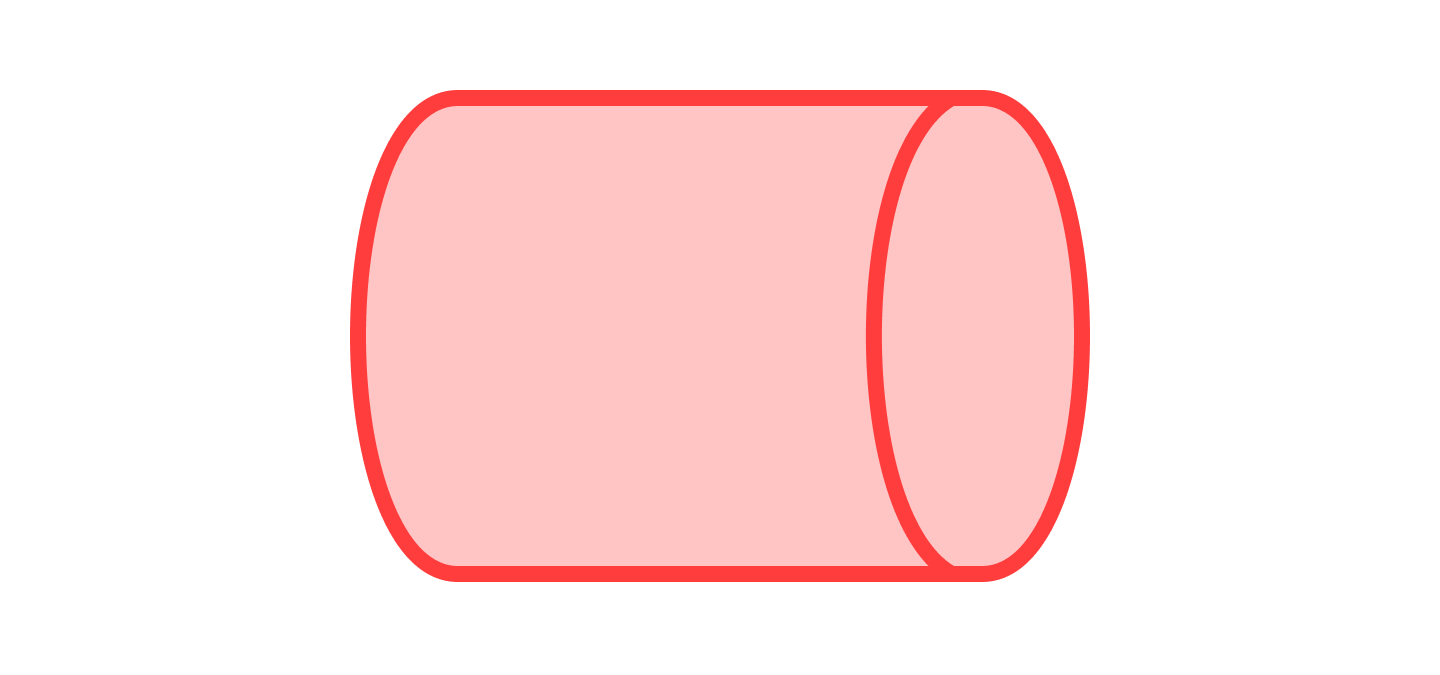
Manual input symbol
The manual input symbol means data was entered by hand. For example, this could mean the data was typed on a keyboard.
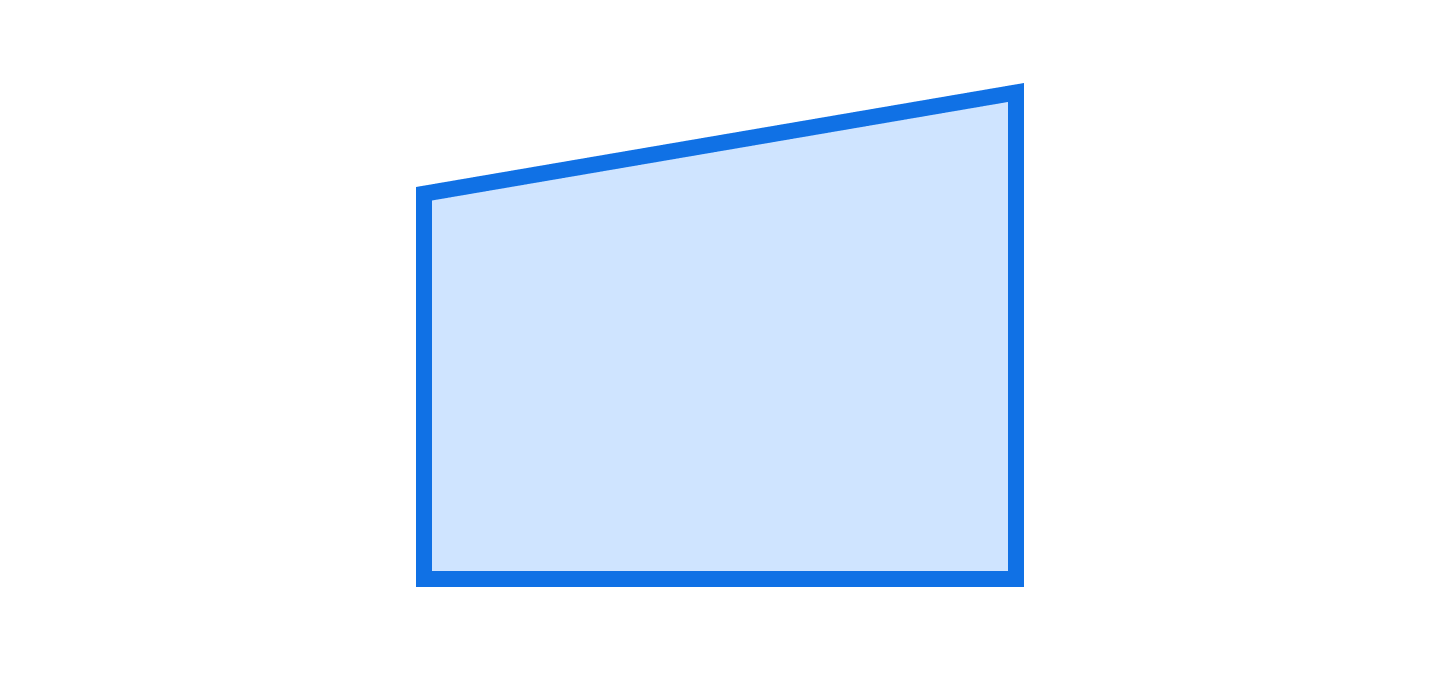
Manual operation symbol
The manual operation symbol indicates that a step was performed manually rather than automatically.
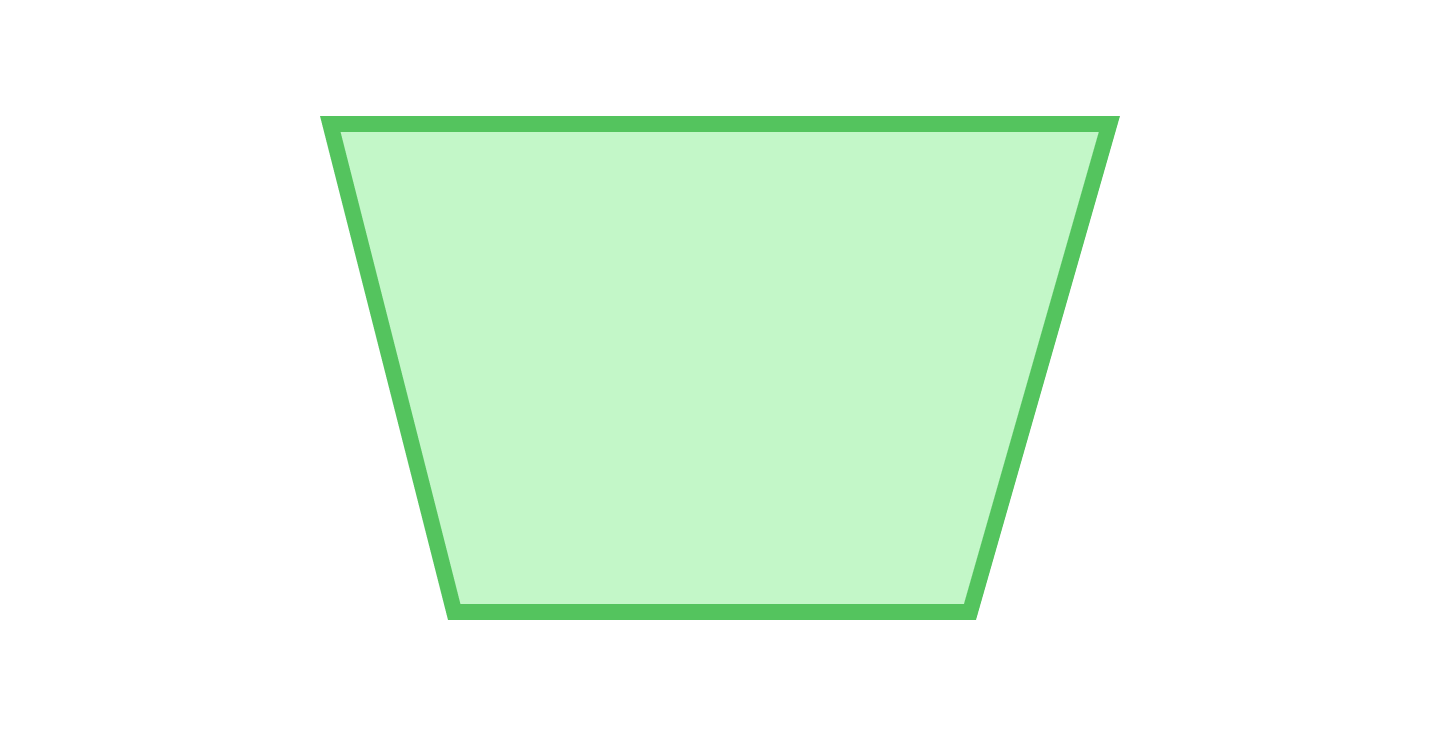
Predefined process symbol
The predefined process symbol indicates that the process is defined elsewhere and is very well-known.

Preparation symbol
The preparation symbol indicates a setup that prepares for another step.

Merge symbol
Merge symbols combine multiple paths into a single path.
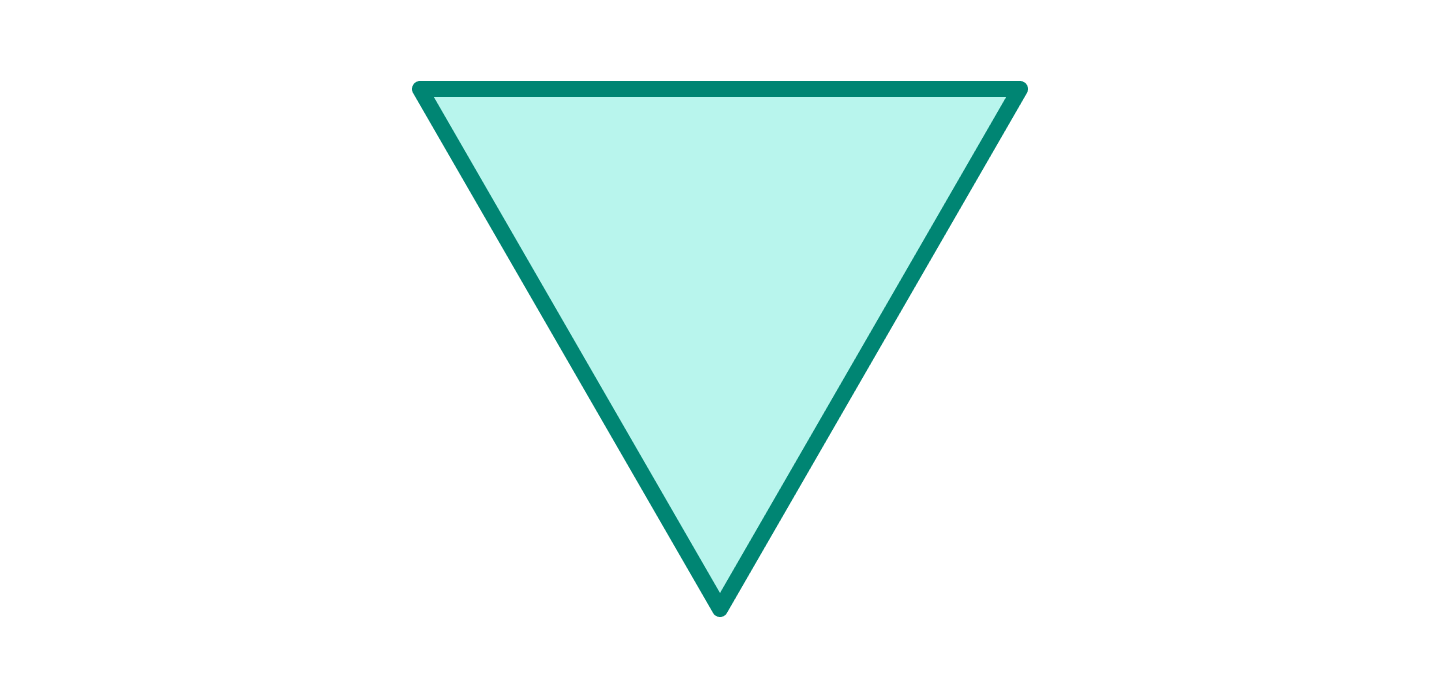
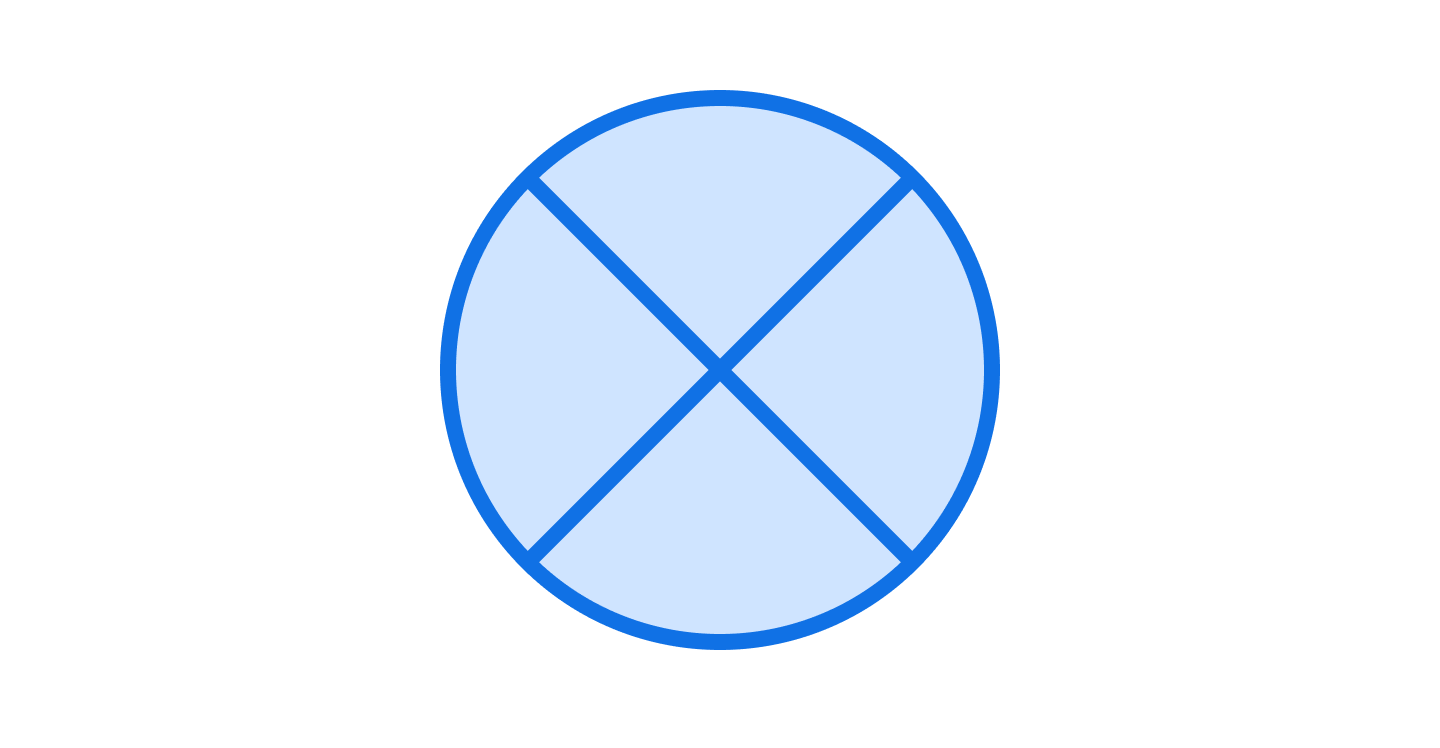
Or symbol
The or symbol indicates that flow continues down two or more paths.
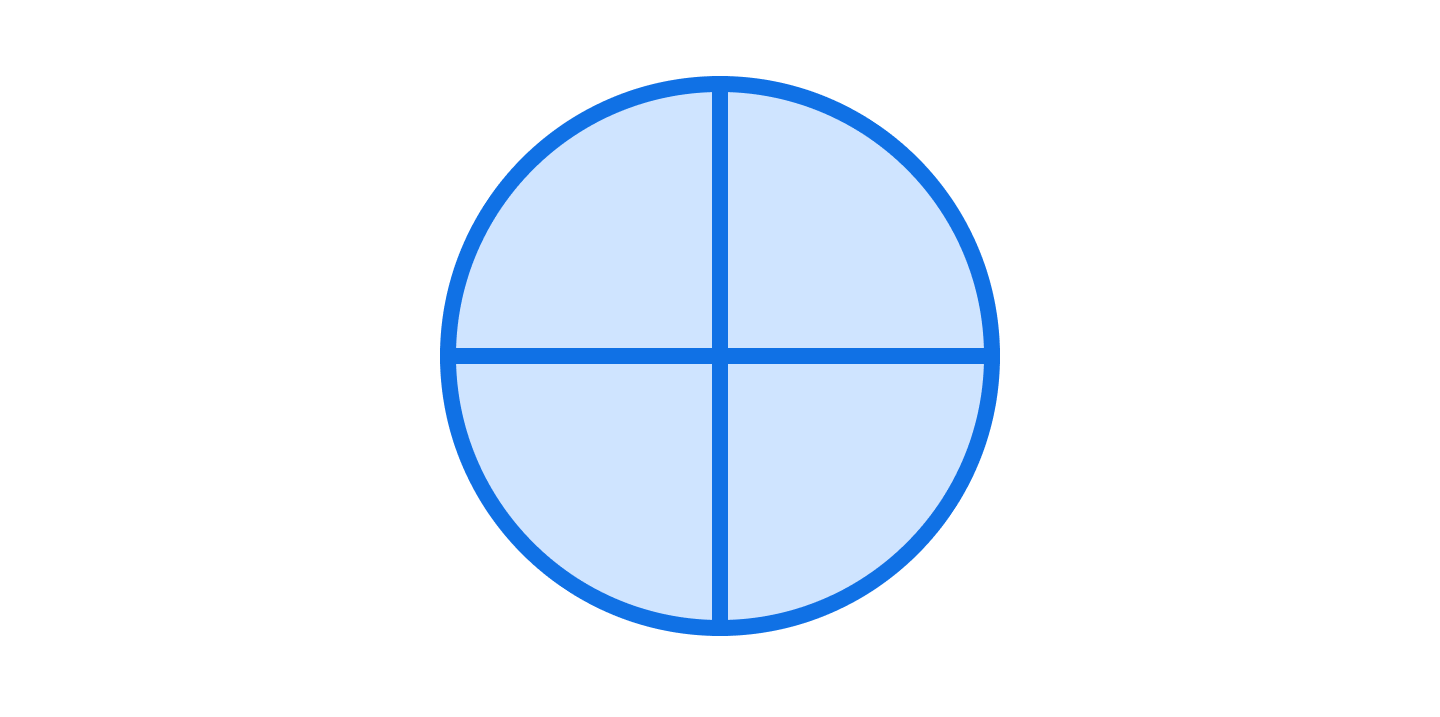
Summing junction symbol
Summing junction symbols indicate the sums of several converging inputs.
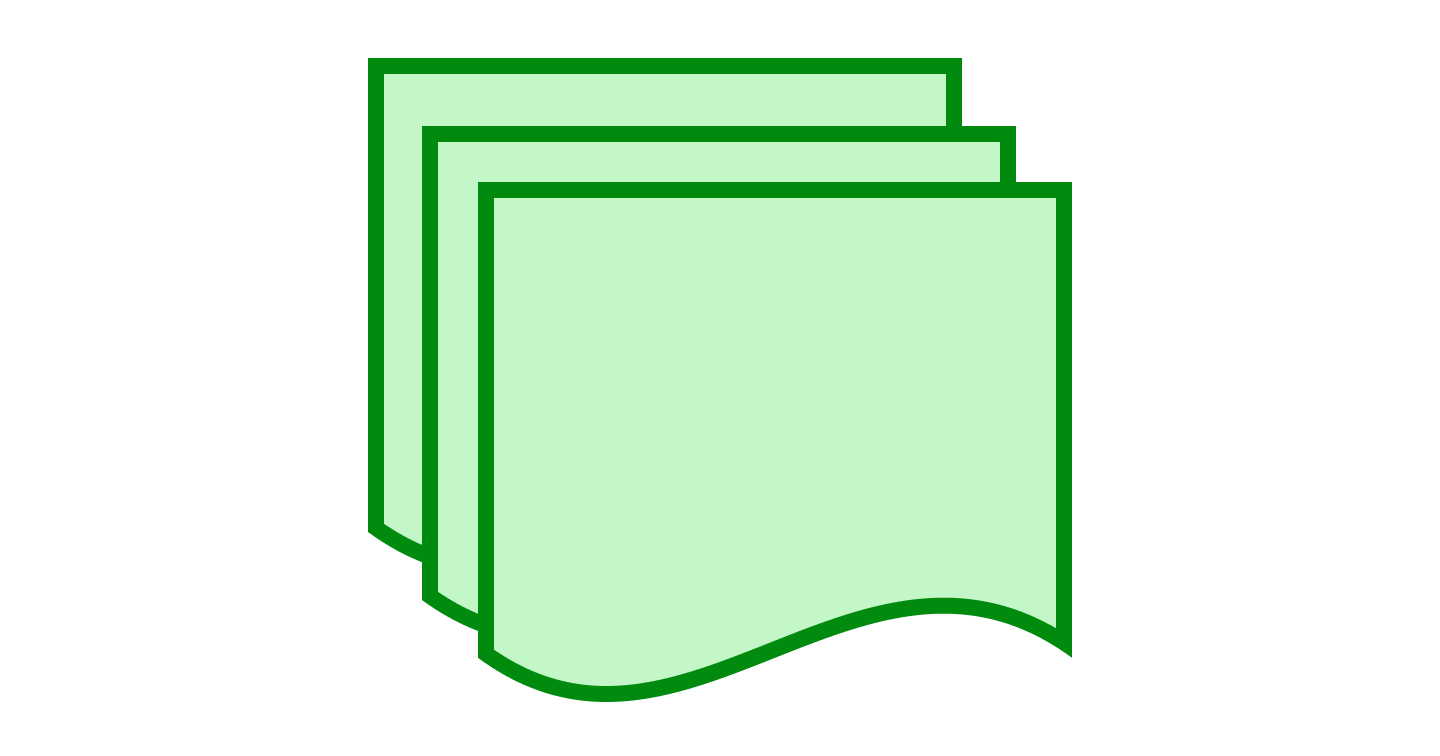
Multiple documents symbol
A multiple documents symbol indicates that there are multiple documents or reports
Display symbol
A display symbol indicates where information is displayed.
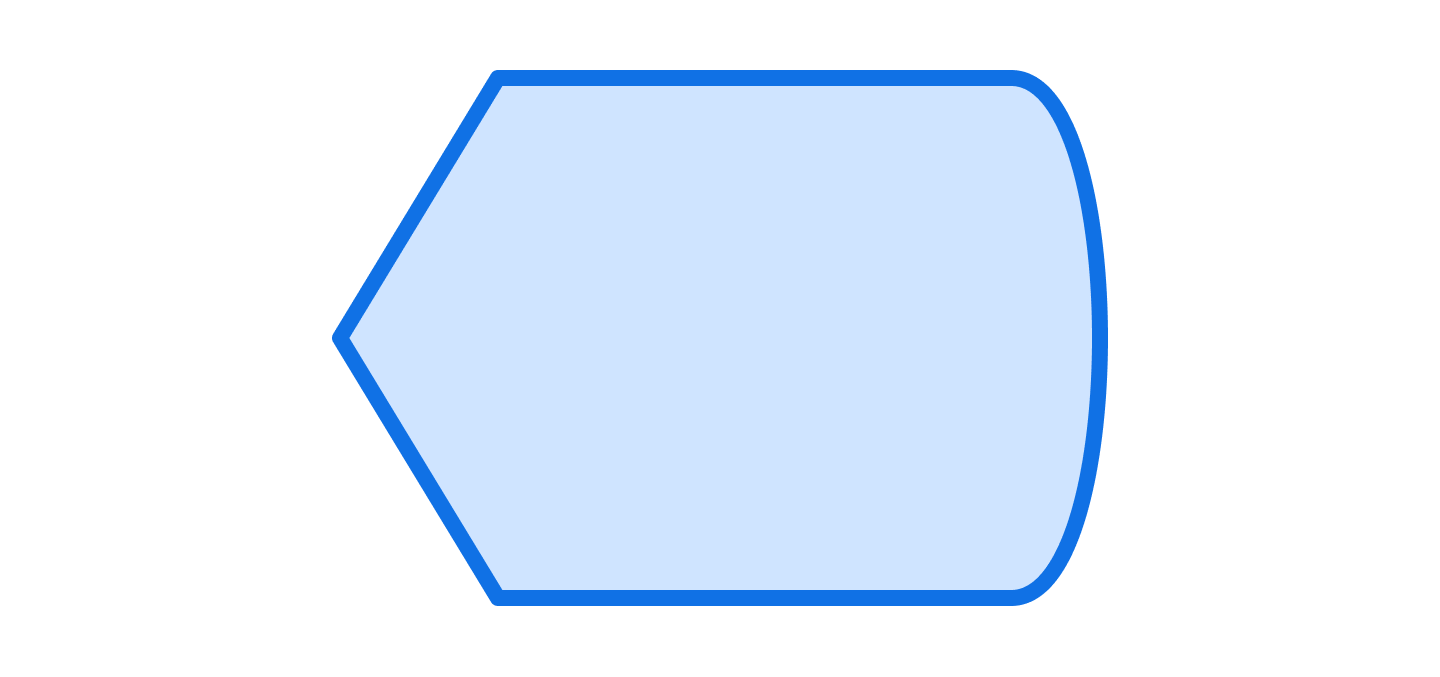
Delay symbol
The delay symbol indicates a segment of delay in a process.
Paper tape symbol
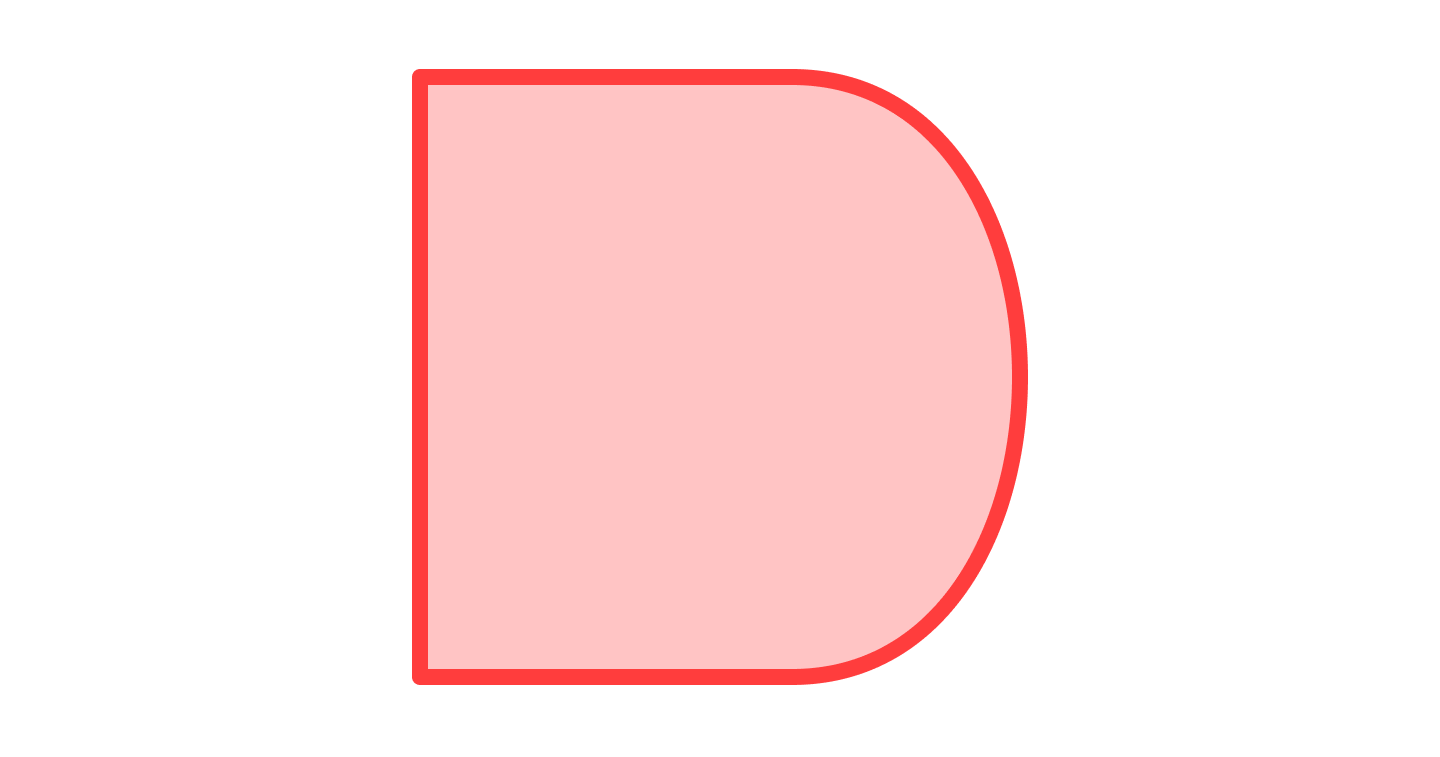
The paper tape symbol represents input/output, but it is outdated. It is only used for very old computers and CNC machines.

What's the difference between standard and non-standard flowchart symbols?
Standard flowchart symbols follow defined specifications, while non-standard symbols adapt those shapes for a specific audience. Both work as long as each symbol's meaning stays consistent.
Flowchart symbols were first standardized by ANSI in the 1960s. These shapes were later adopted internationally as ISO 5807:1985, which defines consistent notation across charts.
You can still use symbols in a non-standard way when it makes sense to your readers. Just apply each shape consistently so its meaning is clear every time. For a deeper walkthrough of the conventions, see our flowchart tutorial.
How to use flowchart symbols in Lucidchart
In Lucidchart, drag standard symbols from the shape library, drop them on the canvas, and connect them to form a flow. Trusted by 100 million users across more than 180 countries, opens in a new tab, Lucidchart makes it easy to build clear charts quickly.
Open Lucidchart, opens in a new tab from a template or a blank canvas.
Drag and drop shapes from the shape library on the left.
Connect shapes by dragging from the connection dots on each shape.
Keep the flow moving top-to-bottom or left-to-right for readability.
Upload your own shape if a symbol isn't in the library.
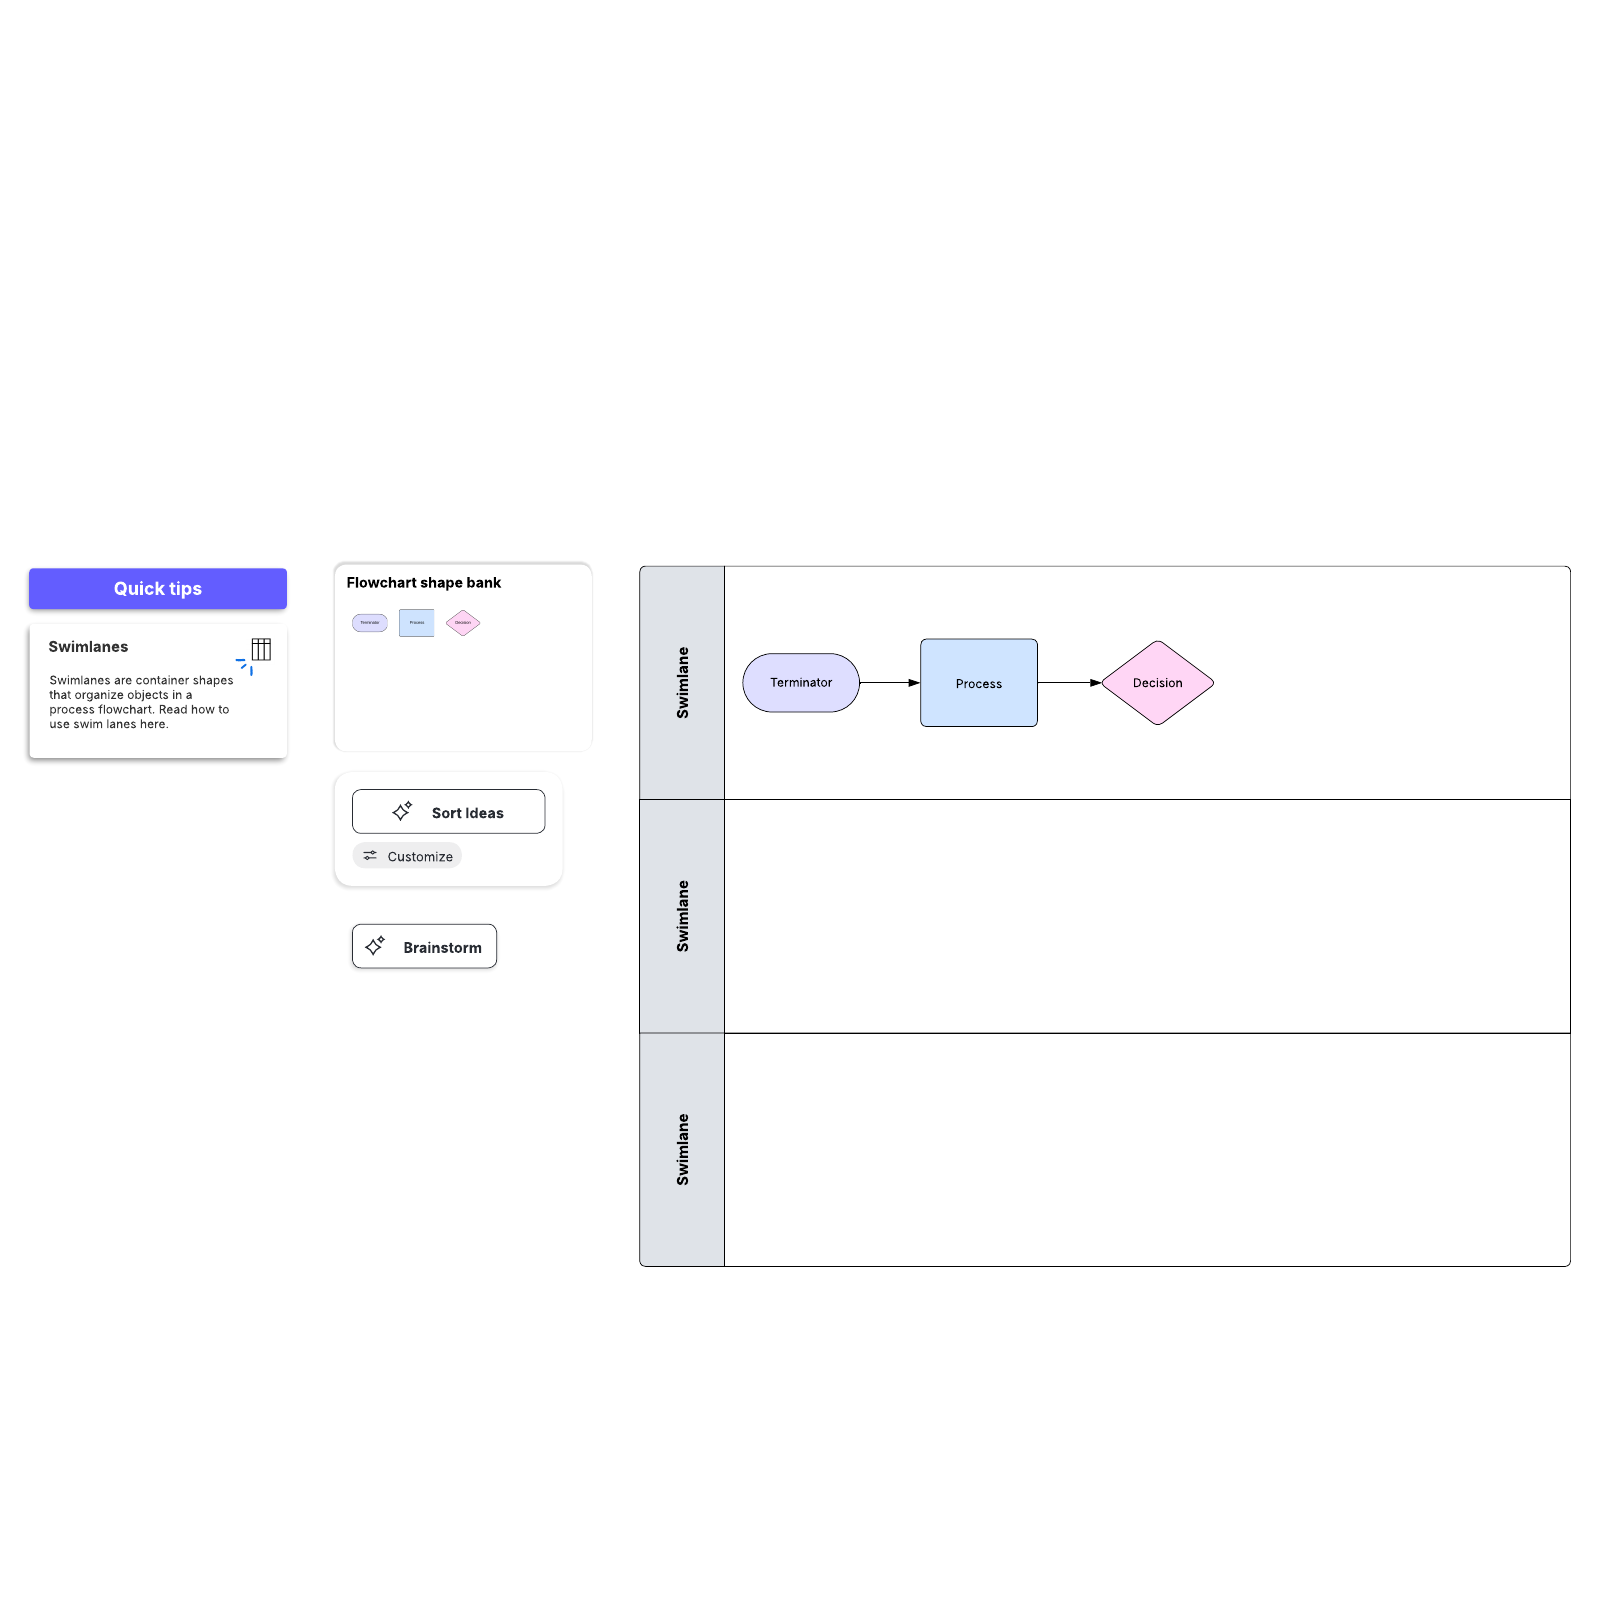
For multi-team processes, add swimlanes to show who owns each step. See the full process in our flowchart tutorial, opens in a new tab.
Lucid AI, opens in a new tab also allows you to quickly generate a flowchart—with or without swimlanes—from a text prompt. You can attach files to provide additional context.