Key takeaways
Lucidchart builds a flowchart in five steps: Open the editor, pick a template, add shapes, connect them, and share or publish.
You can generate a first draft from a text prompt with Lucid AI, then refine every shape by hand.
Standard symbols such as terminator, process, decision, document, and input/output give every reader a shared visual language.
Limiting a flowchart to three colors keeps it readable, and you can apply a theme or build one with AI.
Flowcharts have shaped business process work since the 1920s, when Frank and Lillian Gilbreth presented the flow process chart to ASME.
Learning how to make a flowchart turns a tangled process into a diagram anyone can follow. A flowchart maps each step, decision, and outcome, so teams see how work actually flows from start to finish.
This guide walks through the core process of creating a flowchart in Lucidchart, Lucid's intelligent diagramming solution. Lucid is used by more than 100 million people across 180+ countries. You will also learn the formatting rules, symbols, and shortcuts that keep your diagram clear.
How to make a flowchart in Lucidchart: Five steps
You can build a flowchart in Lucidchart by starting from a template or blank canvas, then adding and connecting shapes. Follow these five steps:
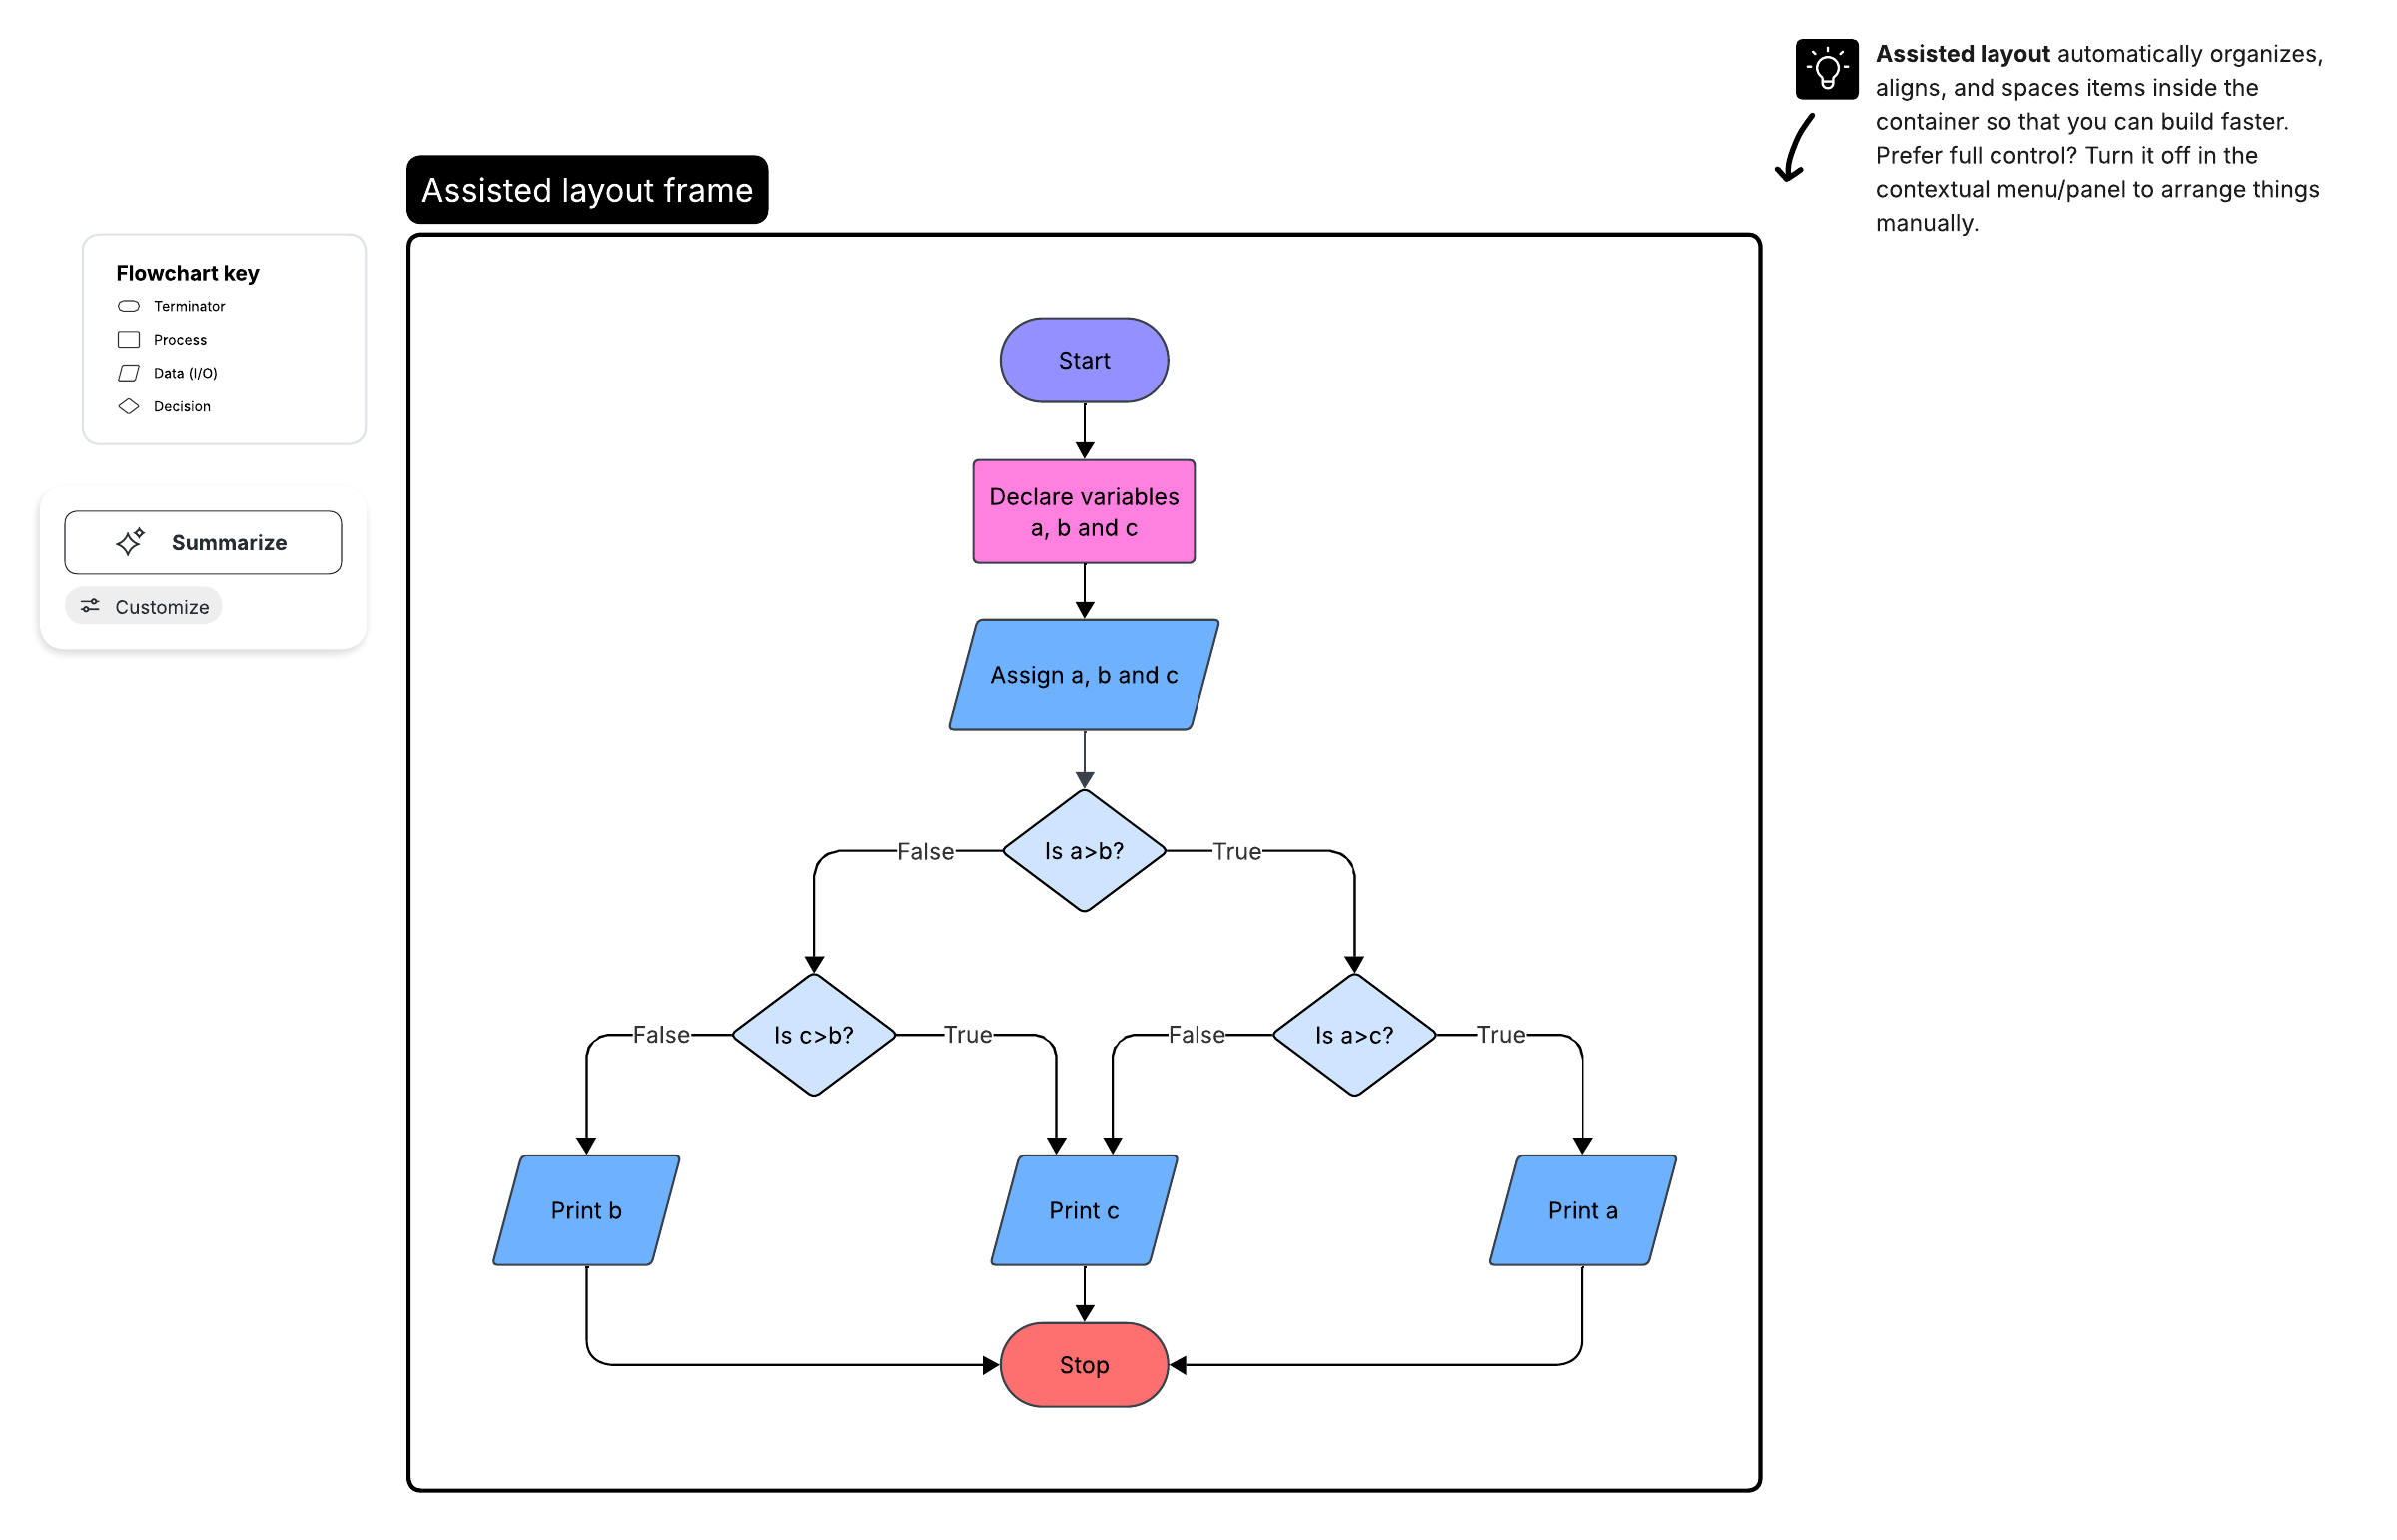
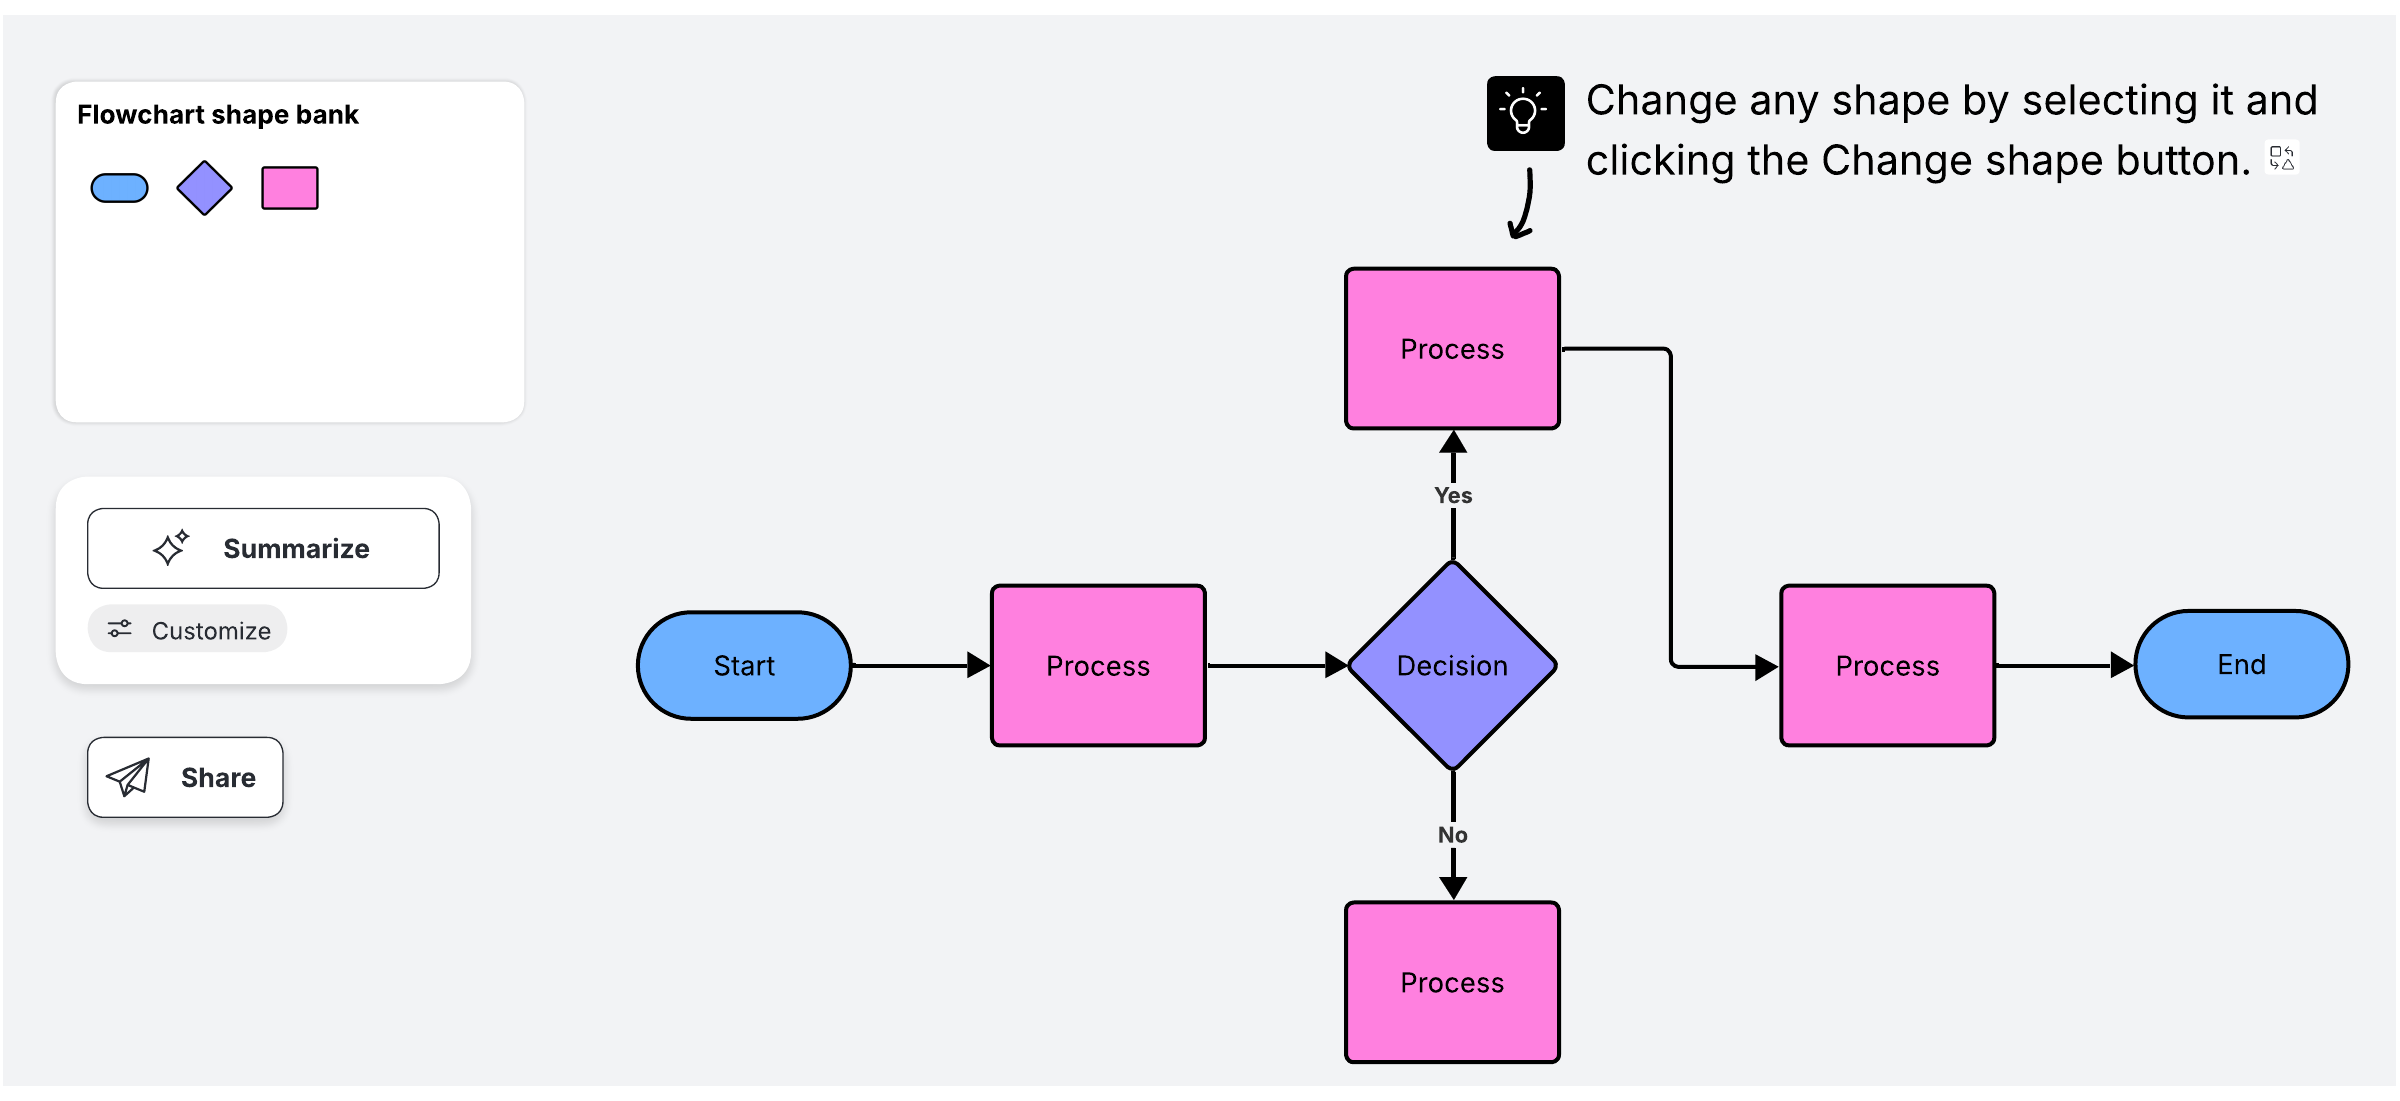
Open the Lucidchart editor and start from a customizable flowchart template or a blank canvas.
If you use a template, click any shape to edit its text, move it, or delete it.
If you start from scratch, drag and drop shapes from the toolbar on the left. Add images, links, and formatting as needed.
Connect shapes by hovering over one shape and dragging from the connection points that appear to the next shape.
Share your work with the Share button in the top right. You can also publish your document as a URL, a PDF, or an image by clicking the file menu in the top header and then Publish.
Video: Getting started in Lucidchart in under 5 minutes
This quick tutorial covers the basics of Lucidchart. You will watch how to create a professional flowchart, customize shapes with your company colors, and share the diagram for real-time collaboration.
How do you generate a flowchart with AI?
You can generate a flowchart with AI in Lucid by describing the process in a text prompt, and Lucid AI turns that prompt into an editable diagram. Creating a flowchart this way gives you a working first draft in seconds, rather than having to build every shape by hand.
Follow these steps to create a flowchart with AI in Lucid.
Type a prompt that names the steps or decisions you want to map.
Let Lucid AI generate the shapes and connectors for you.
Refine the result by editing text, adding shapes, and adjusting the layout.
For a deeper walkthrough, see more information about Lucid’s AI flowchart generator.

Video: Generate a diagram using AI
This video shows how to generate and iterate on a diagram in Lucidchart using AI. You will see how a text prompt becomes a first draft and how to keep refining your diagram.
What are the formatting rules of a flowchart?
Good flowchart design keeps your diagram readable and consistent. Apply these formatting rules as you build.
Make start and finish points obvious. With terminator shapes, place the starting point at the top left and the end point at the bottom right. Color the start point green and the end point red.
Customize shapes for clarity. Select a shape and use the shape editing bar to change its appearance.
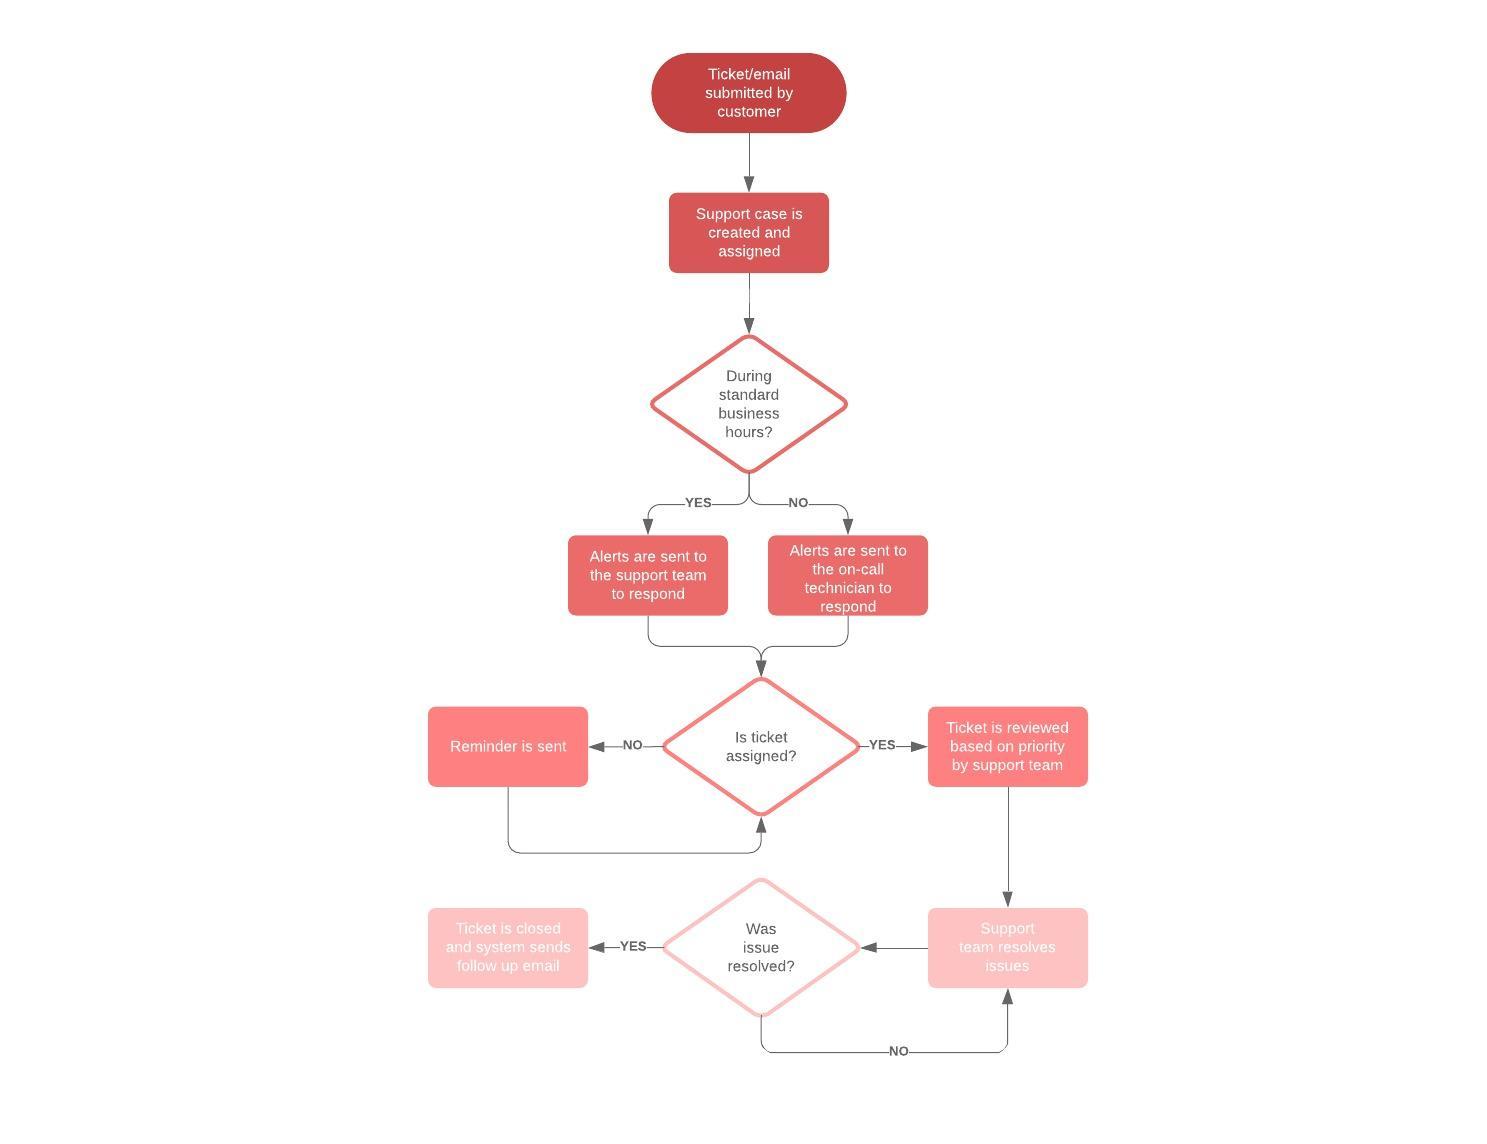
Use flowchart colors strategically. Stick to no more than three colors. Apply a theme for a consistent look.
Edit lines for readability. Adjust thickness, style, and arrows, and keep lines flowing top to bottom or left to right.
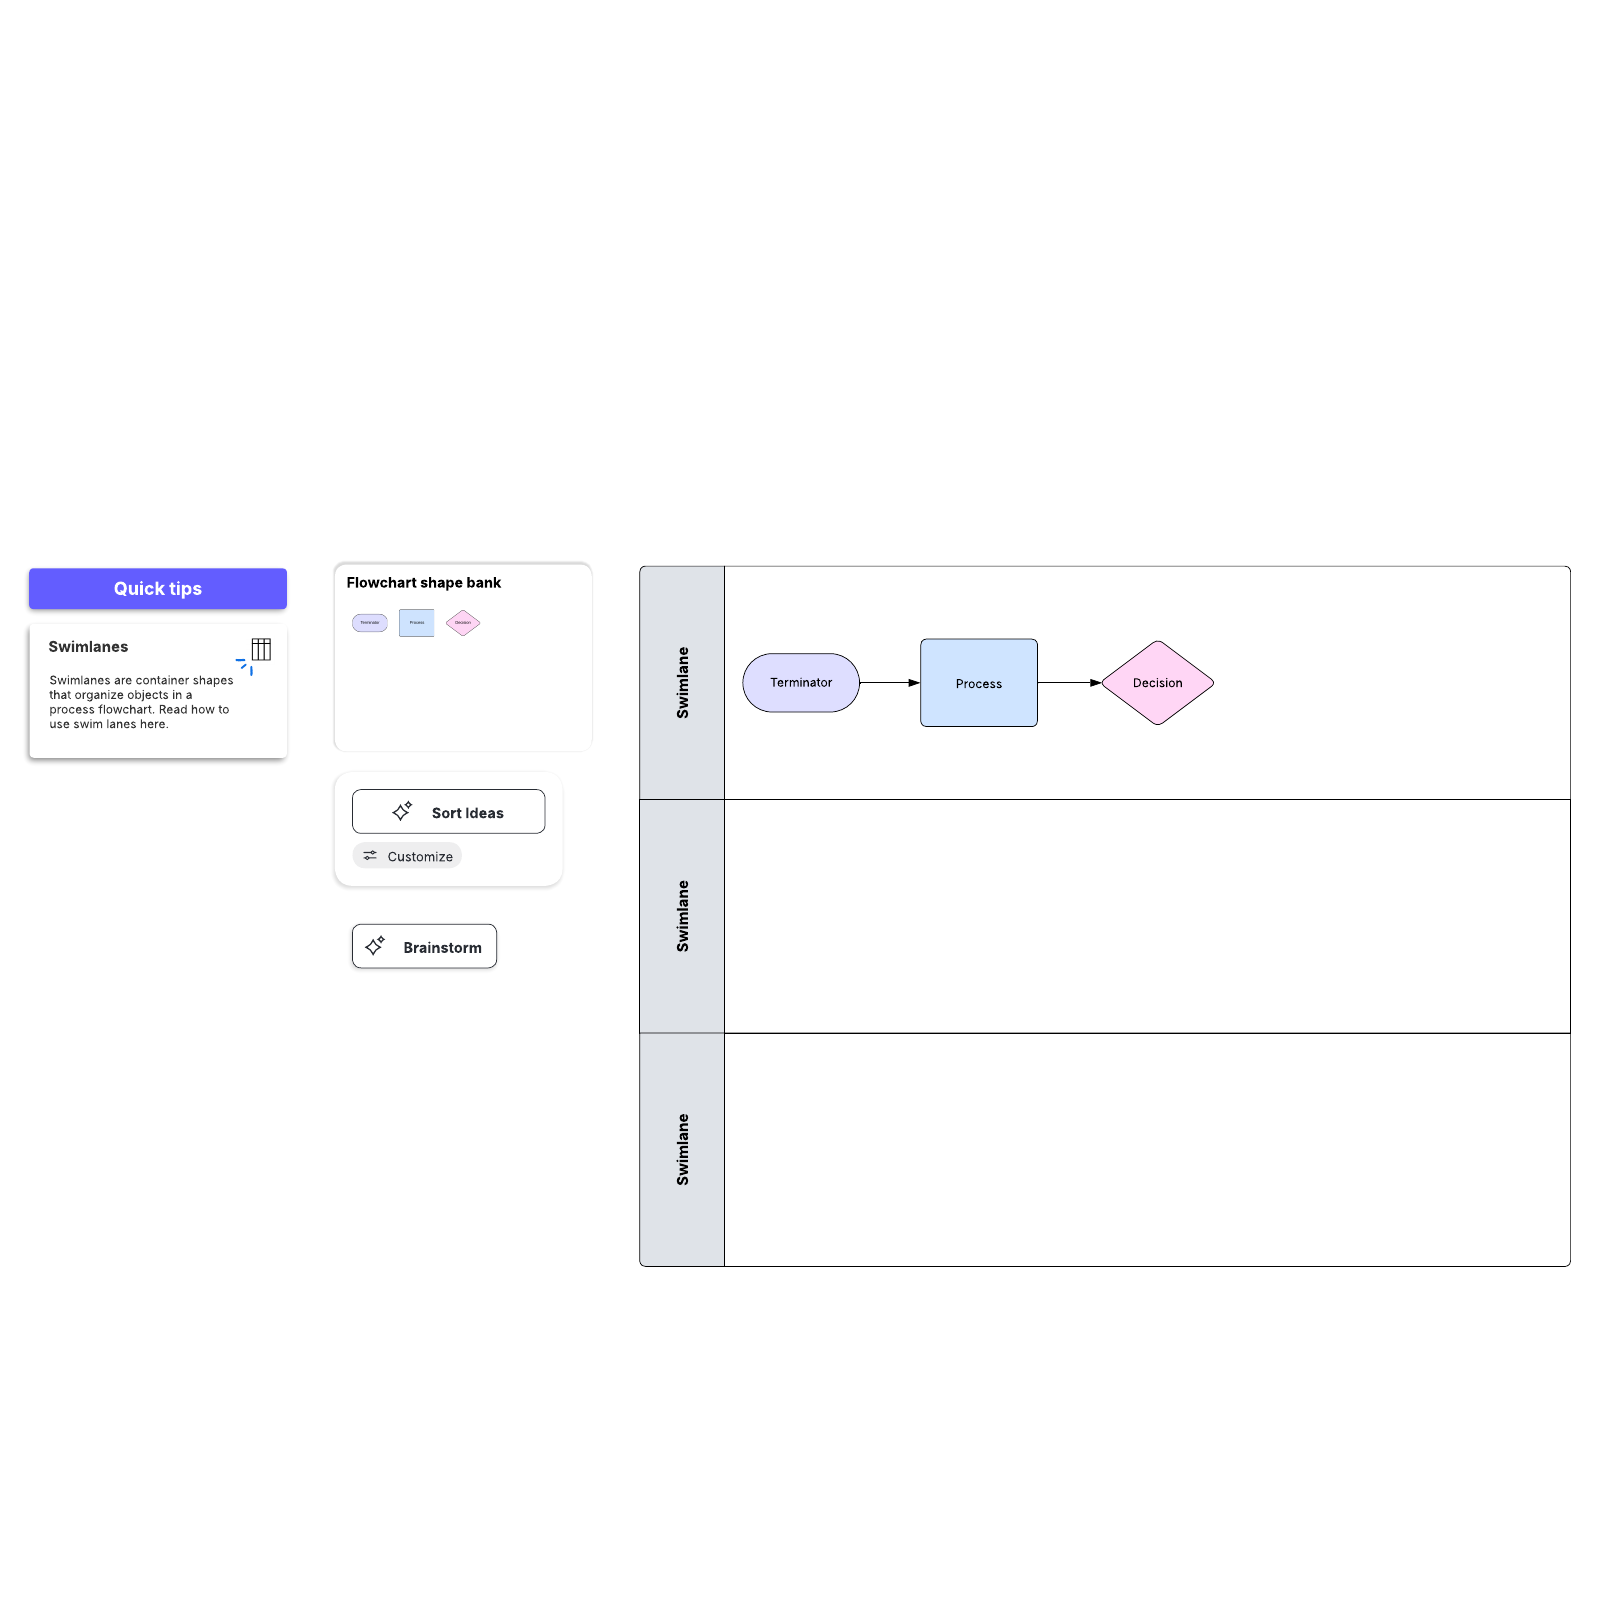
Consider swimlanes for multi-team processes. Lanes show who owns each step when work crosses departments.
Tutorial video: How to build your own workflow diagram
This tutorial walks through the process of building a workflow diagram in Lucidchart. It compares a workflow diagram to a flowchart and covers BPMN, UML, and swimlanes for more advanced processes.
What are the most common flowchart symbols?
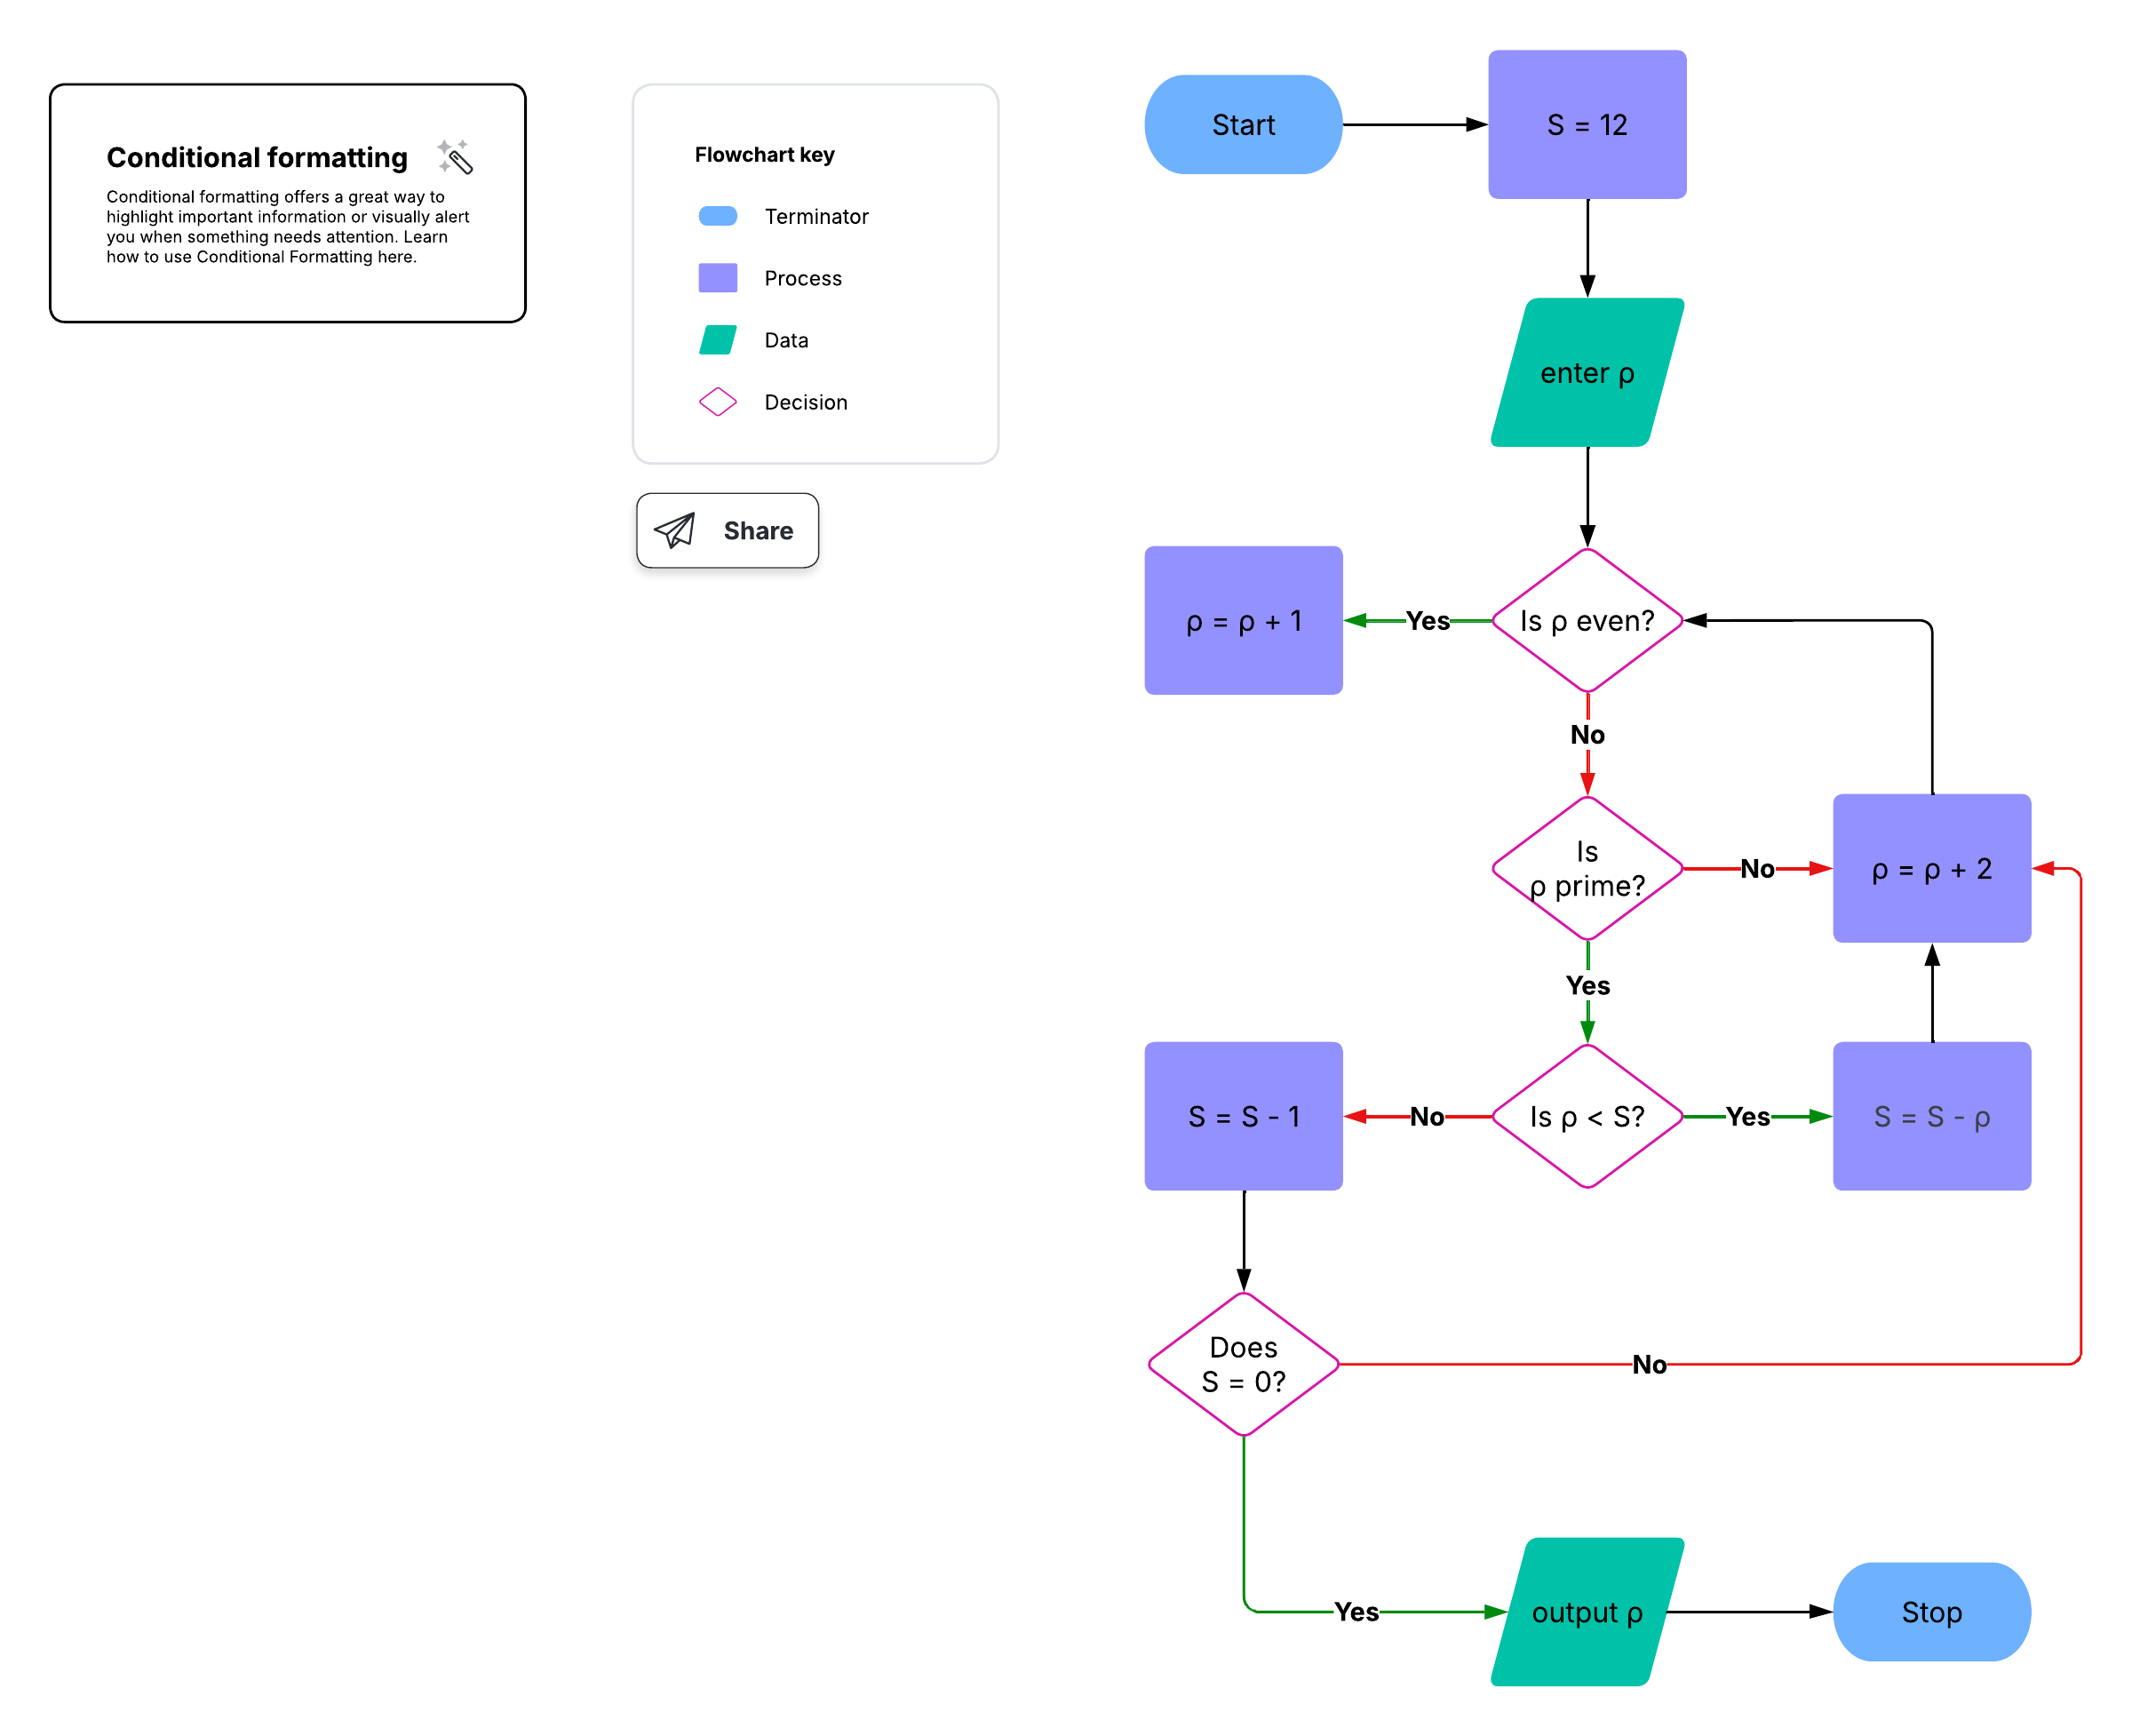
Flowchart symbols give each part of a process a standard meaning that any reader can recognize. A few core shapes are common in most diagrams, such as:
Terminator: marks the start or end of a process
Process: represents an action or step
Decision: shows a branching yes or no question
Document: indicates a report or printed output
Data or input/output: captures information entering or leaving the process
Connectors: link steps within a diagram or across pages
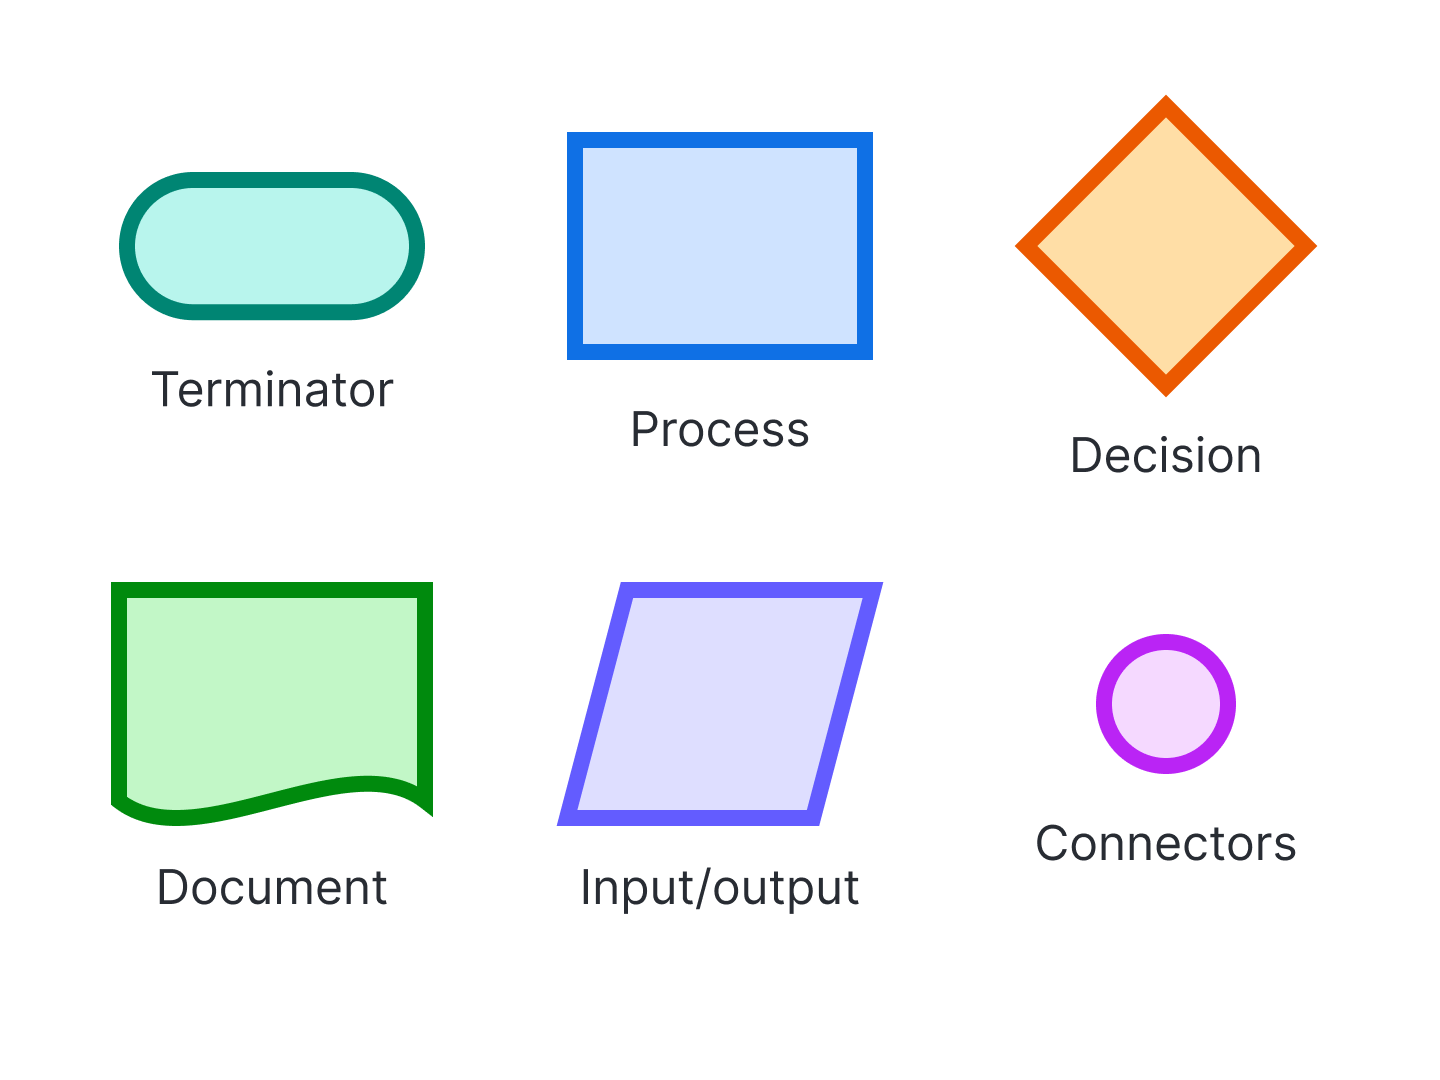
For definitions and examples of every shape, see the guide to flowchart symbols and notation.
When were flowcharts invented?
Flowcharts were adopted for business use in the 1920s and 1930s as a way to document and improve processes. The history of flowcharts spans engineering, manufacturing, and early computing. Notable events include the following:
In 1921, Frank and Lillian Gilbreth introduced the flow process chart to the American Society of Mechanical Engineers (ASME).
In the late 1940s, Herman Goldstine and John von Neumann used flowcharts to plan computer programs.
In 1947, ASME adopted a standard symbol system for flowcharts.
In the 1960s, Kaoru Ishikawa named the flowchart one of the seven basic tools of quality control.
How are flowcharts used in computer programming?
Developers use flowcharts to plan an algorithm's logic before writing code. Several related methods extend this practice, including:
UML diagrams, which model the structure and behavior of software systems
Nassi-Shneiderman diagrams, also called structograms, which show structured program logic in nested blocks
DRAKON, which offers a visual language for describing algorithms and procedures
Pseudocode, which pairs with flowcharts to describe steps in plain, code-like language
Can you make a flowchart in Excel or PowerPoint?
You can build a flowchart in either Excel or PowerPoint, though a dedicated diagramming tool such as Lucidchart gives you more shapes to choose from and easier editing. Lucid provides step-by-step guides for creating a flowchart in both applications.
Learn the shapes-and-gridlines approach in the guide to making a flowchart in Excel.
Follow the slide-based method in the guide to making a flowchart in PowerPoint.
With templates, shape libraries, and robust AI capabilities, Lucidchart makes it easy to make flowcharts and clarify processes.