Key takeaways
Making a flowchart in Excel takes seven core steps, starting with formatting a square grid before you place a single shape. Creating a flowchart in Excel requires manual formatting, layout setup, and shape alignment.
Lucidchart speeds up the process with customizable flowchart templates, real-time collaboration, and an automated shape library.
You can build a diagram in Lucidchart and insert it directly into your spreadsheet using the Lucidchart add-in for Excel. Building a flowchart in Lucidchart and inserting it into your spreadsheet is a faster, more editable alternative to drawing one by hand in Excel.
Excel spreadsheets hold densely packed data that is useful but hard to interpret at a glance. A flowchart in Excel maps the relationships among those data points, adding clarity to your workbook. This guide walks through how to make a flowchart in Excel step by step. It then shows a faster path with Lucidchart, a visual workspace used by more than 100 million people across 180+ countries.
Microsoft Excel includes built-in features for creating a flowchart directly inside a spreadsheet. It takes some preliminary formatting and manual adjustment to place your shapes and text. We recommend saving time with Lucidchart, but the steps below cover both methods so you can choose what works for your team. If you are new to the format, start by learning what a flowchart is before you build.
How to make a flowchart in Excel step by step
You make a flowchart in Excel by formatting a grid, adding SmartArt or Shapes from the Insert tab, and connecting them with lines. The full process takes seven steps.
Format a grid. Change your column width to match the default row height so cells become squares. For Calibri size 11, set column width to 2.14. For other fonts, check the row height first, then match the column width to it.
Enable snap to grid or shape alignment. Go to Page Layout > Align and turn on Snap to Grid or Snap to Shape. This keeps shapes evenly spaced as you draw the flowchart in Excel.
Adjust the page layout. Set margins, orientation, and size from the Page Layout tab. Avoid changing the theme, since it alters fonts, colors, row height, and column width all at once.
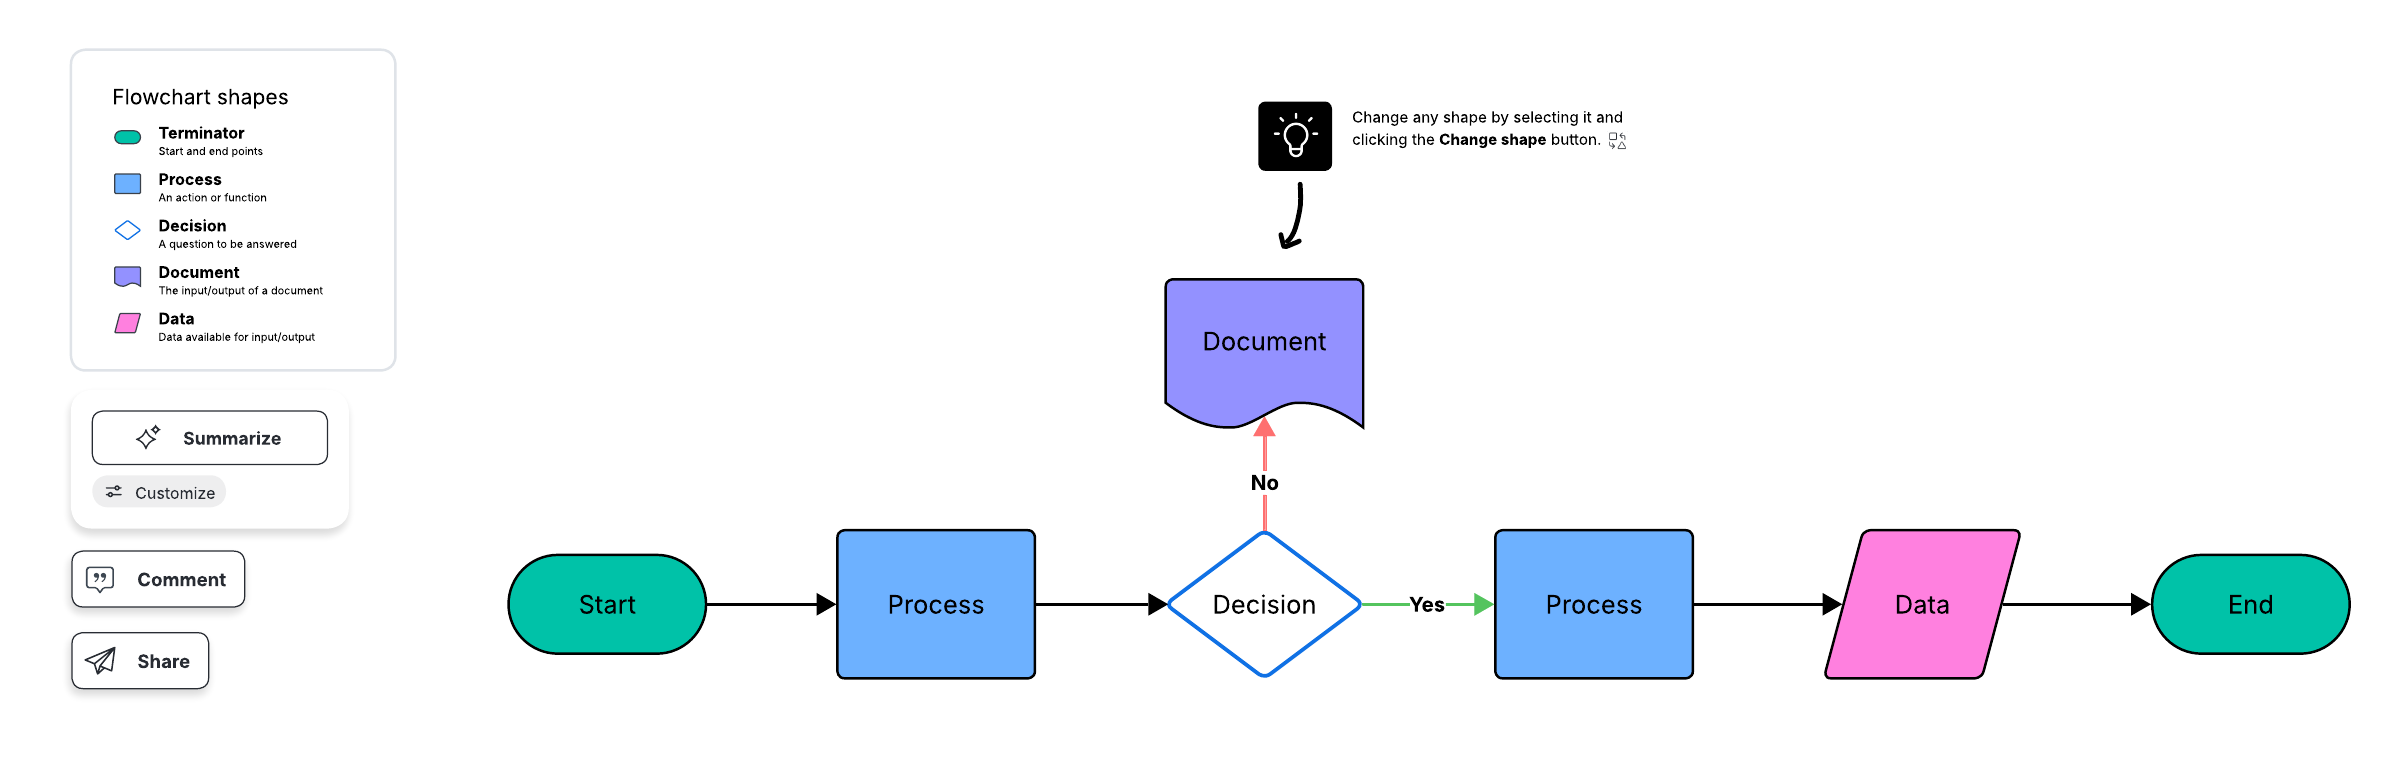
Add shapes. You have two options on the Insert tab. For SmartArt, choose Insert > Illustrations > SmartArt > Process to drop in premade, grouped graphics. For individual objects, choose Insert > Shapes and pick the symbols you need. Match each symbol to its meaning using this guide to flowchart symbols and notation.
Add text. Click a placed symbol and type. SmartArt resizes text automatically, and you can edit it from the ribbon or the text dialog box.
Add lines and arrows. Choose Insert > Shapes, select a line or arrow style, then click and drag to connect two symbols. This is how you draw a flowchart in Excel with directional flow.
Format the flowchart. Select any shape to reveal the Shape Format tab, which offers the most styling options. From there, adjust fill colors, outlines, line thickness, font styles, and transparency.
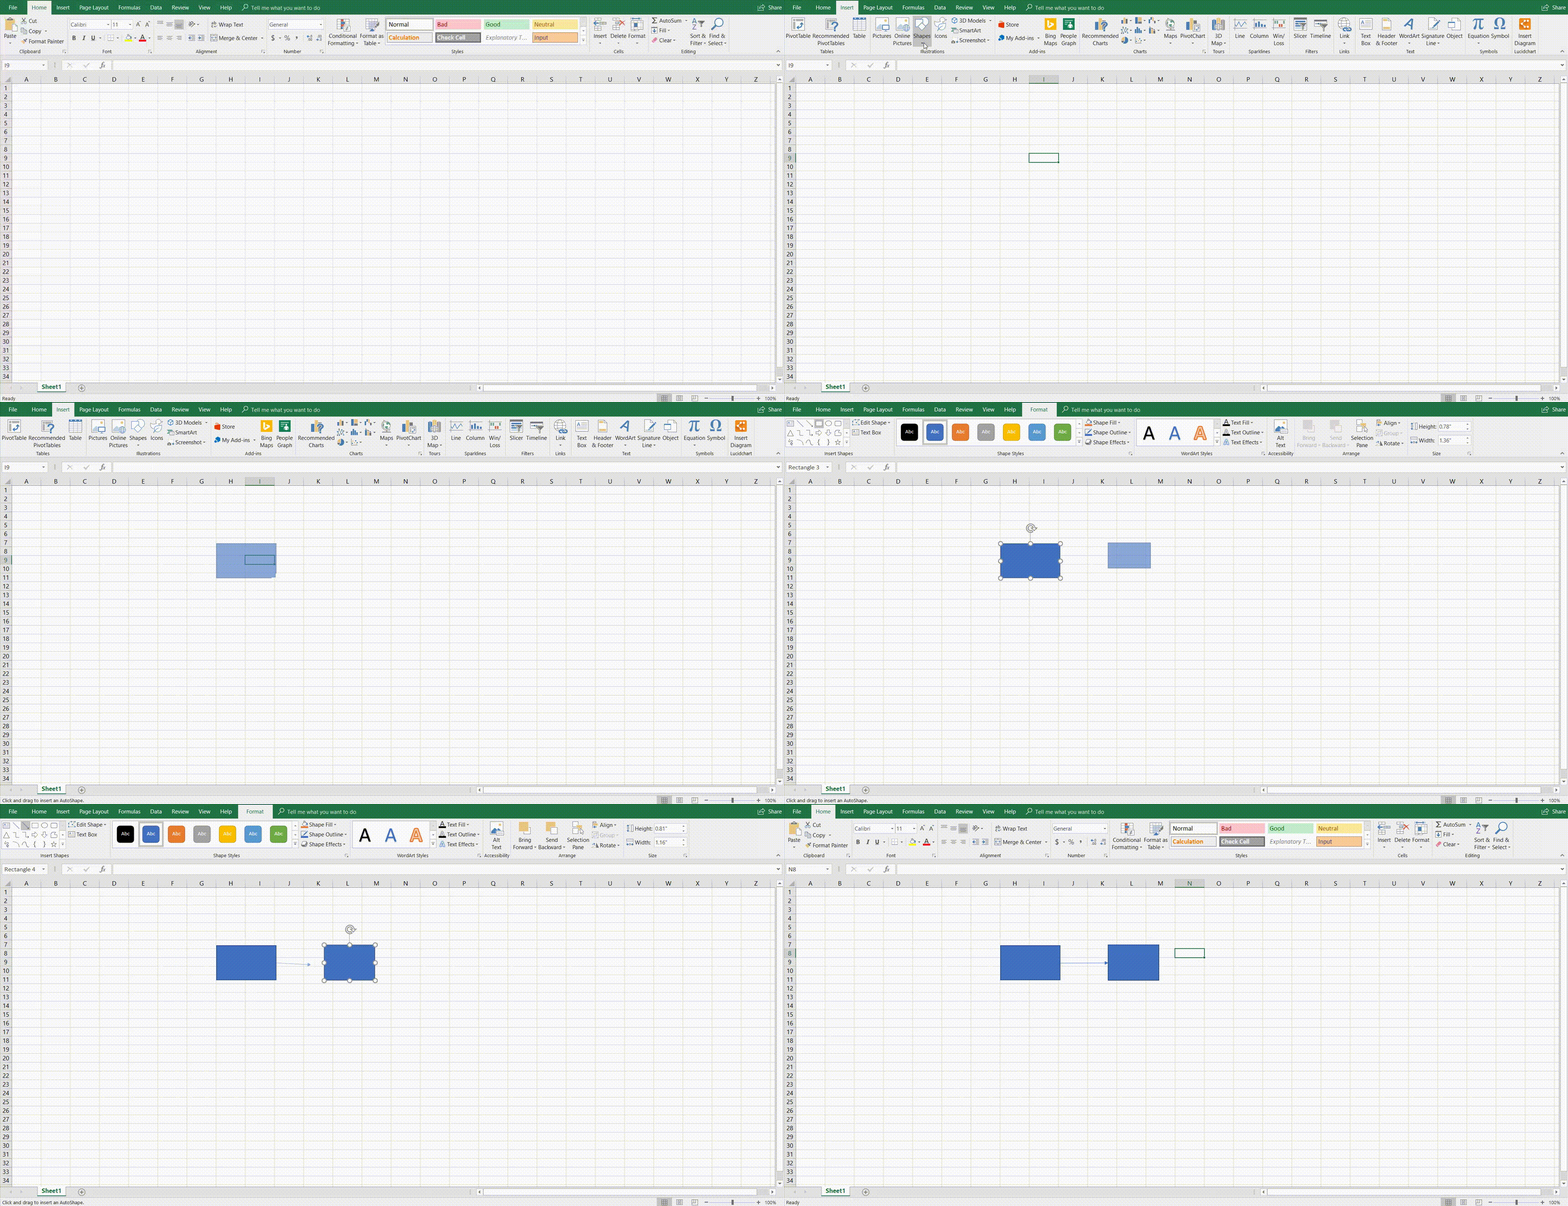
That covers how to create a flowchart in Excel from a blank workbook. For a tool-agnostic walkthrough of the format, see our general guide on how to make a flowchart, opens in a new tab.
How to make a flowchart in Lucidchart
Building a Microsoft Excel flowchart by hand works, but Lucidchart is faster and easier to edit. Sign up with Lucid for free, then create your diagram in four steps.
Sign up for a free Lucidchart account. Click Sign up, enter your name and email, and choose a password.
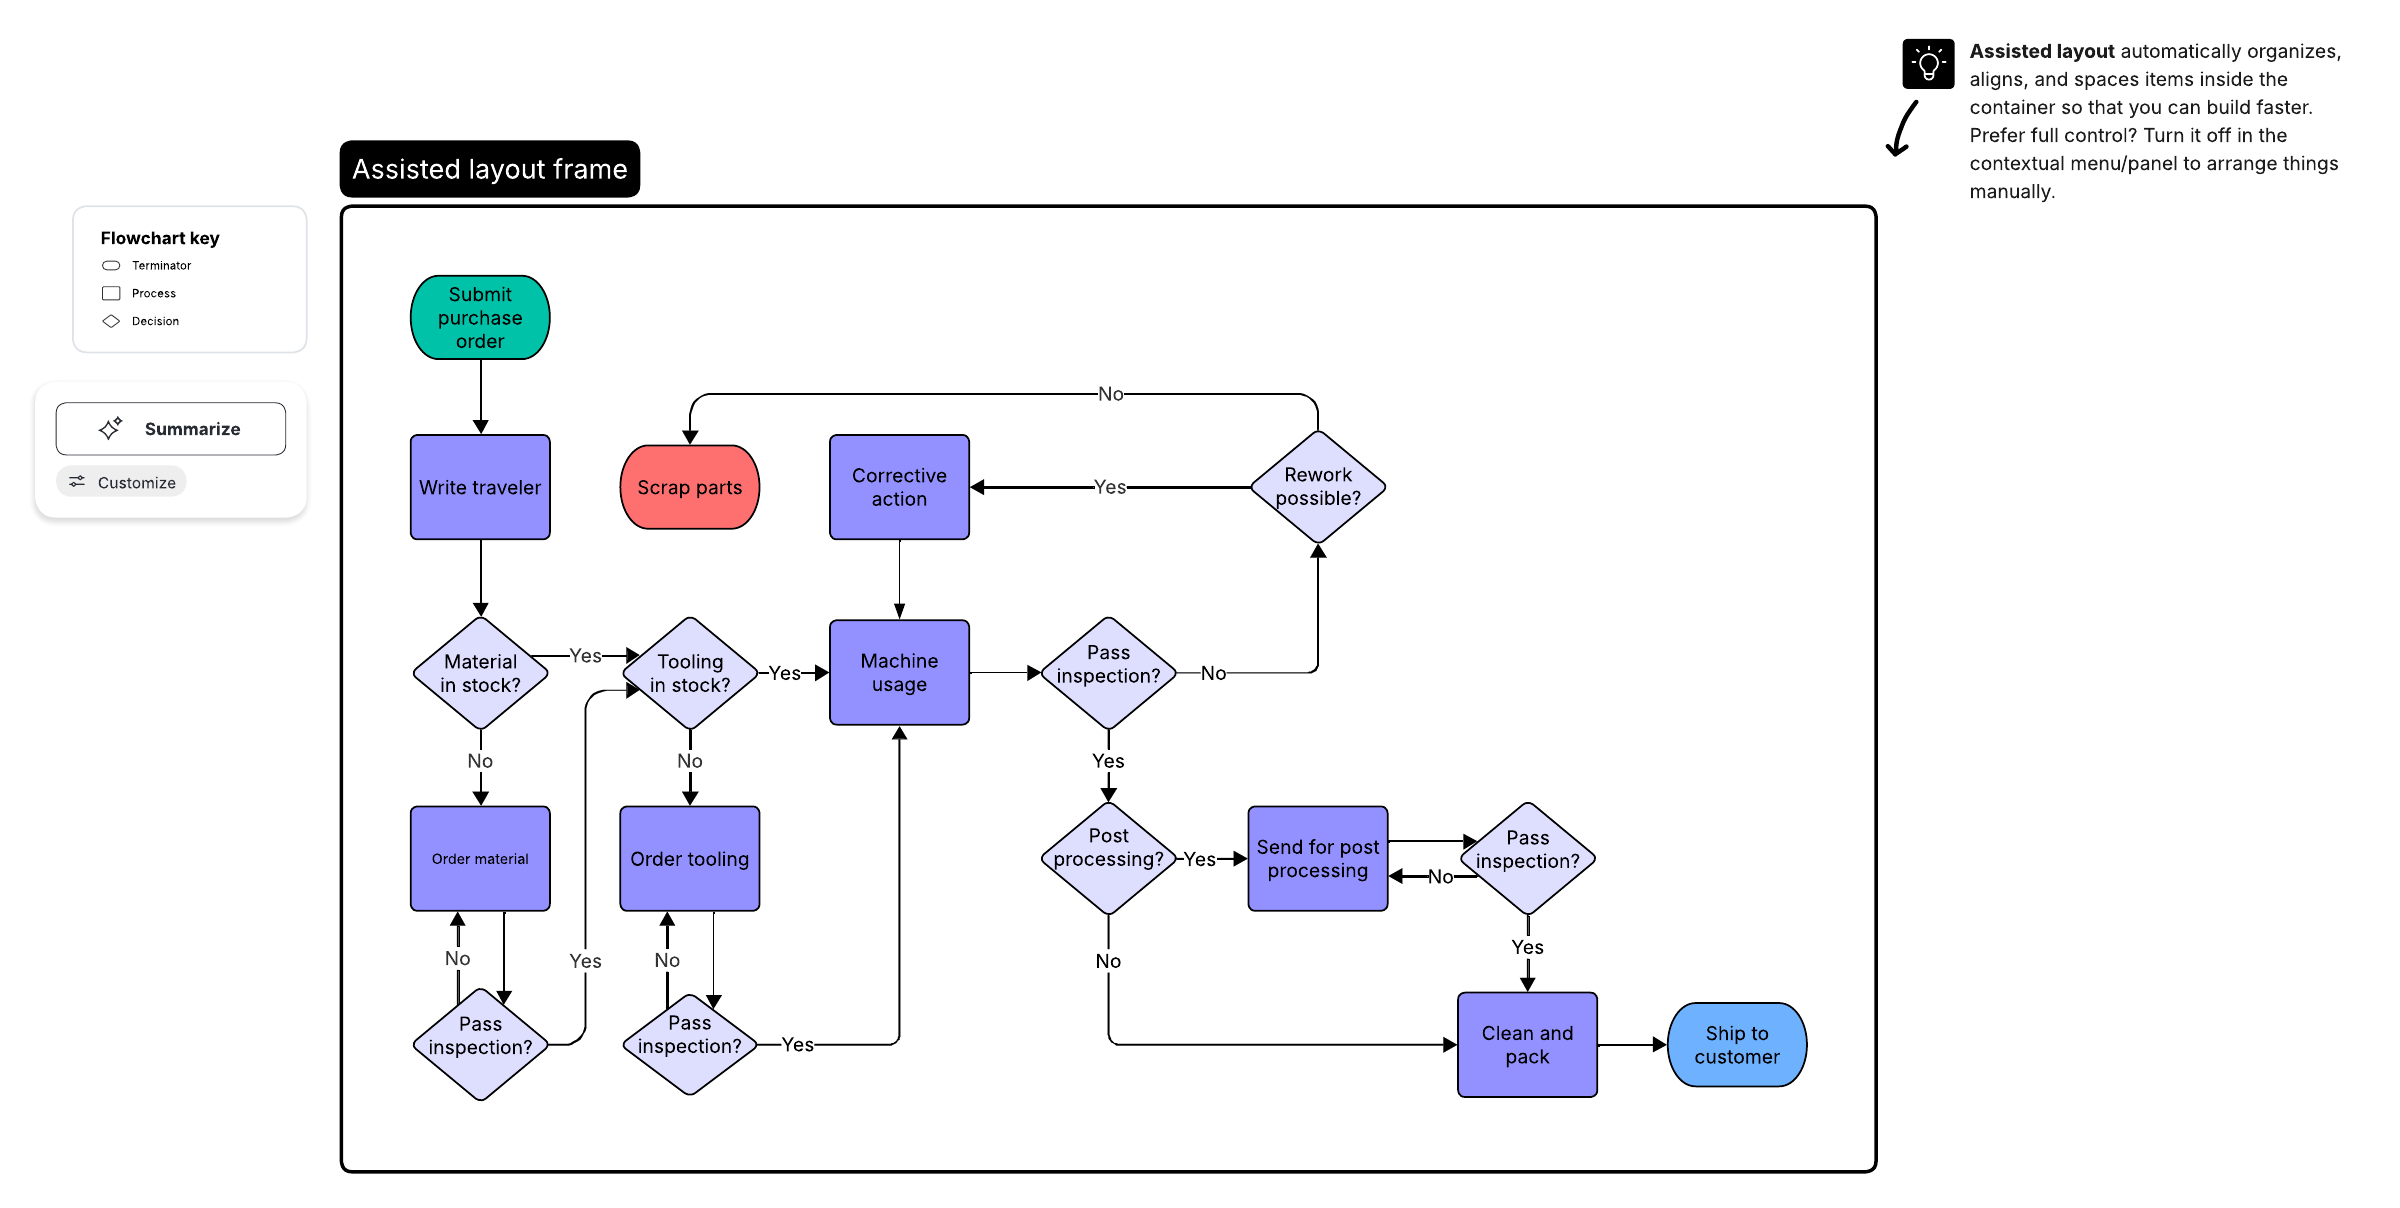
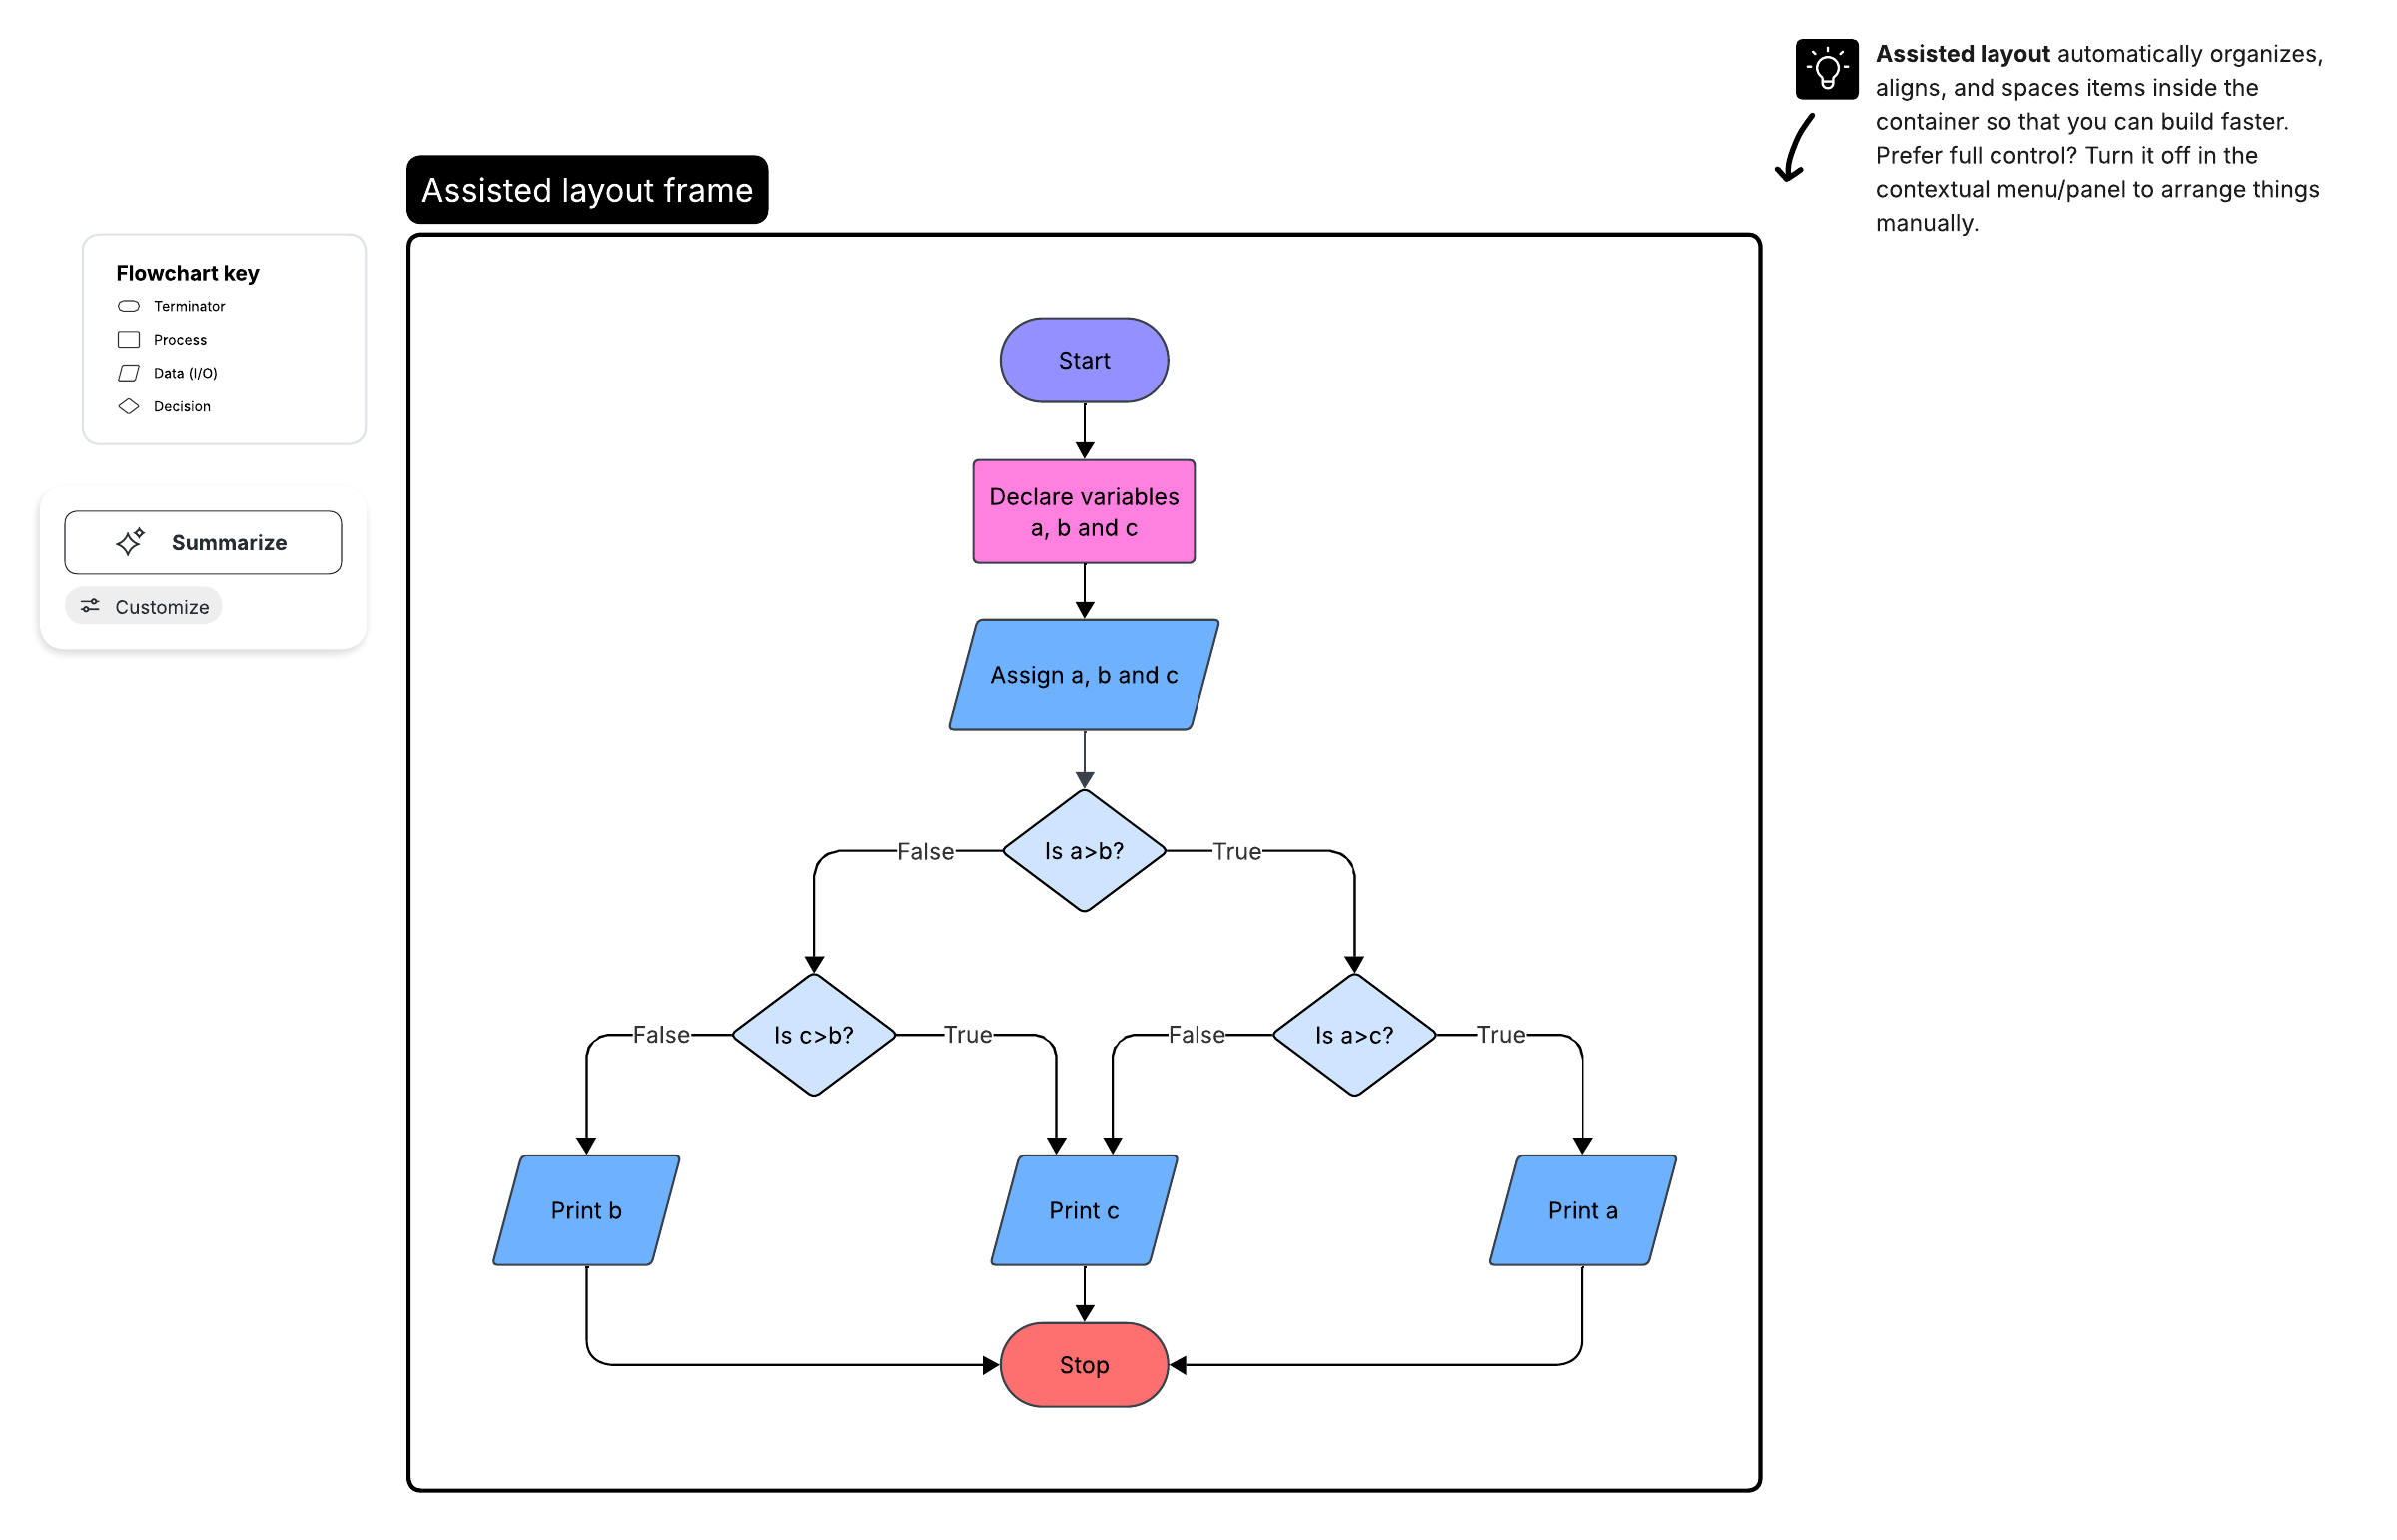
Create a document and add shapes. Start from a template or from scratch. To use a template, click the arrow next to +New, select Create from template, and click Processes > Flowcharts to browse options. Select the template you want, and click Use. To start from scratch, click +New, then drag shapes from the pinned flowchart library and click-drag between them to add connecting arrows.
Add or edit text. Double-click any shape or line, then set font size and style from the toolbar.
Format and style your flowchart. Use the shape editing bar that appears when you click on items in your flowchart to adjust colors, fonts, size, and line weight.
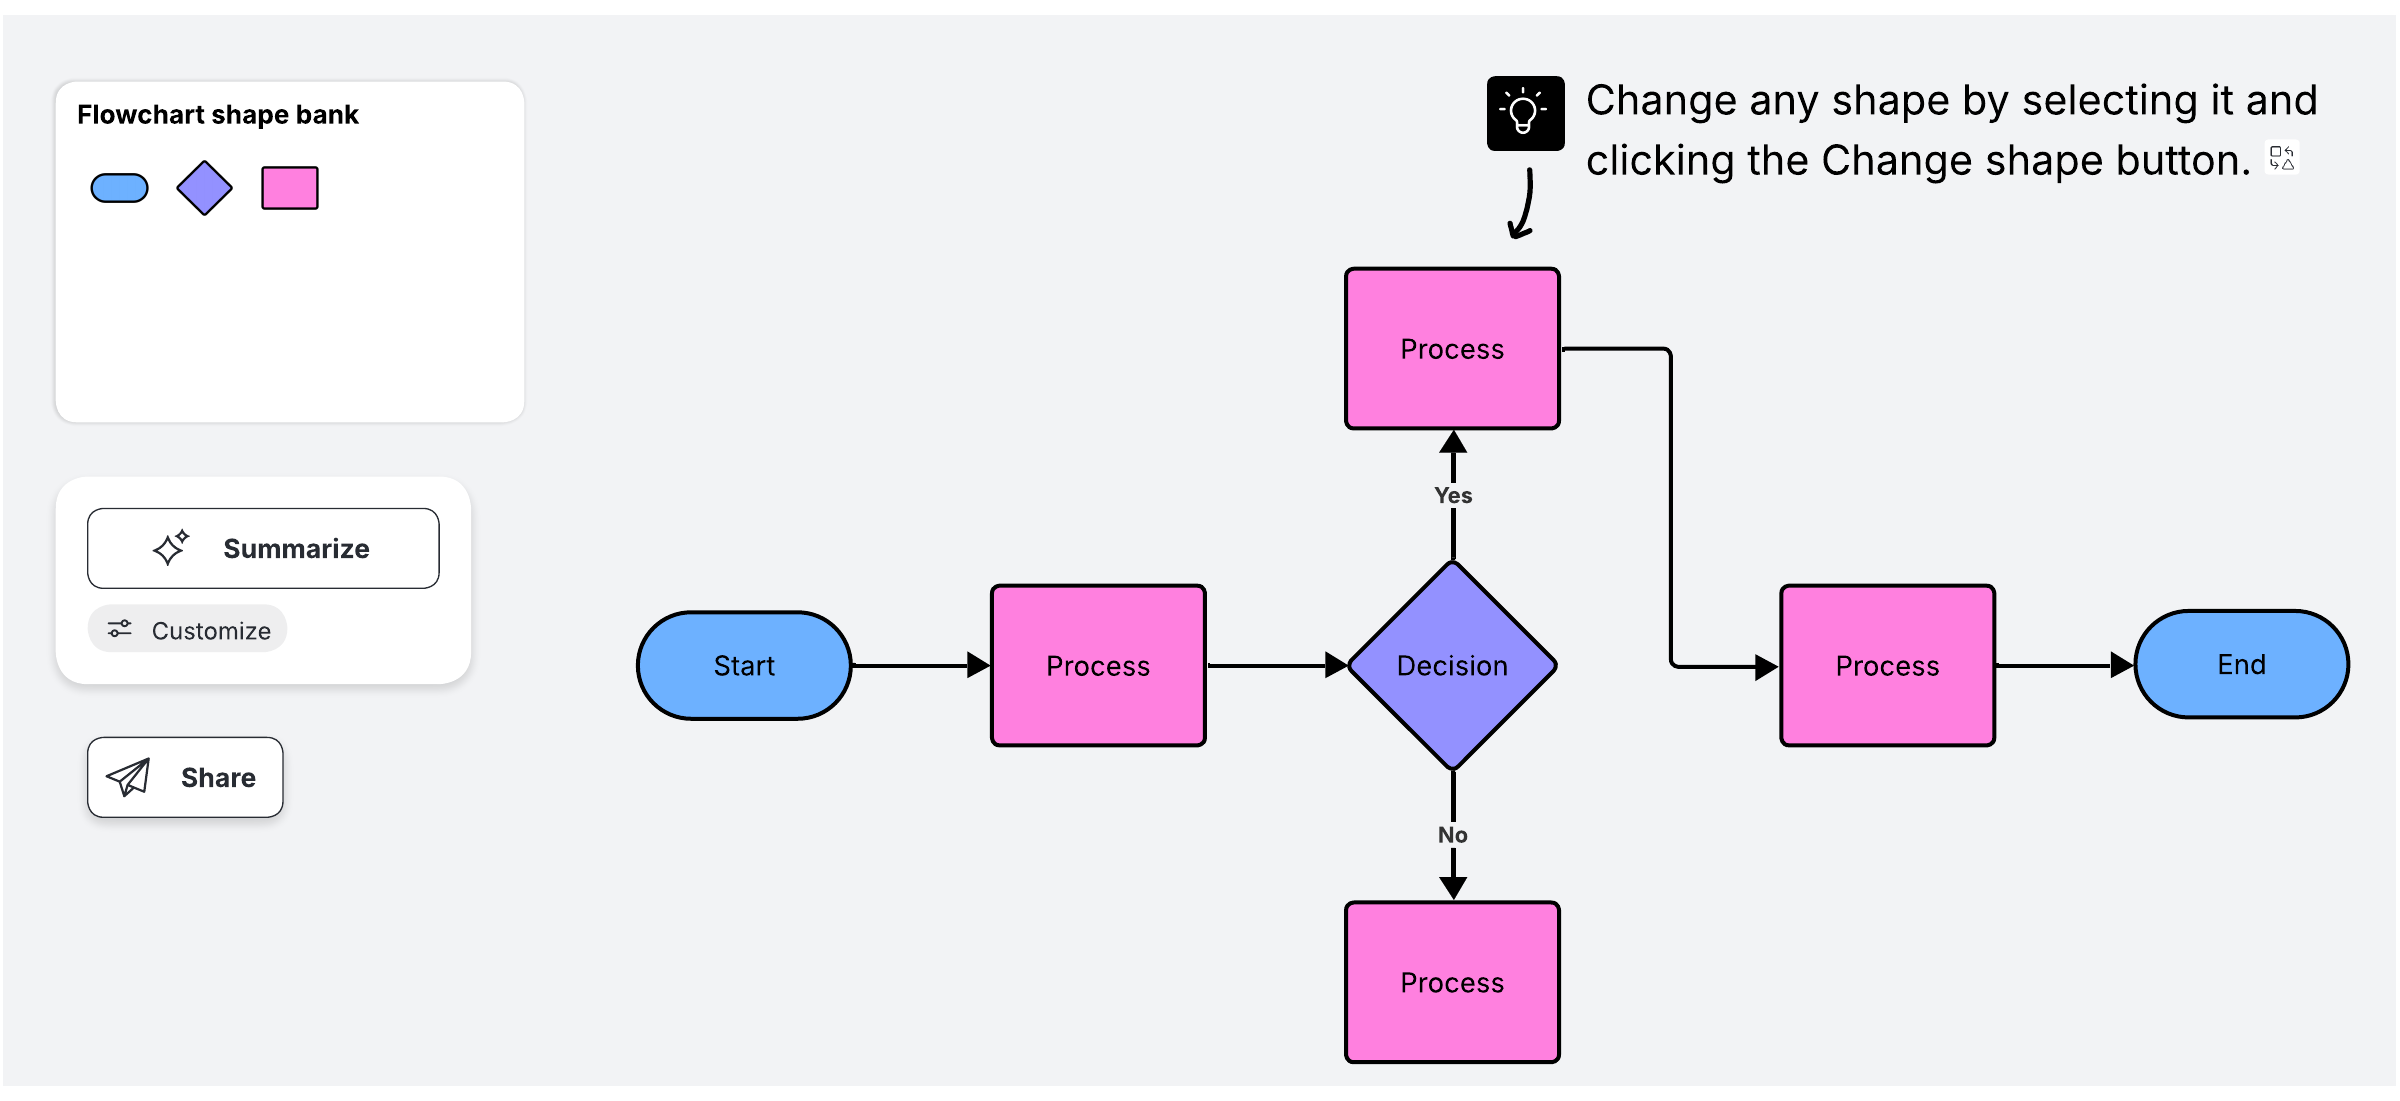
You can build everything from a personal process map to an enterprise Excel workflow chart, all on the same canvas. Explore the full shape set in the Lucidchart flowchart maker, opens in a new tab.
Video: Getting started in Lucidchart in under 5 minutes video
This quick tutorial covers the basics of Lucidchart. It walks through creating professional flowcharts, customizing shapes with your company colors, and sharing documents for real-time collaboration with your team.
Master the basics of Lucidchart in under 5 minutes with this quick tutorial. Learn how to create professional flowcharts, customize shapes with company colors, and share documents with your team for real-time collaboration. Whether you are a beginner or transitioning from Visio, this guide helps you visualize complex processes and streamline your workflow today.
How to insert your Lucidchart diagram into Excel
After you build a diagram, the Lucidchart add-in for Excel drops it into your spreadsheet in a few clicks. Install the add-in, then insert your diagram.
Install the Lucidchart add-in for Excel. In newer Excel versions, go to Insert > Get Add-ins. In older builds, go to Insert > My Add-ins > Store. Search "Lucidchart" and click Add. The menu label varies depending on the Excel version.
Insert your diagram. Open the add-in in from Insert > My Add-ins > Lucidchart, or from the Add-ins button on the ribbon in newer Excel. Select your diagram and click Insert. Re-insert the diagram anytime to apply your latest edits.
Making a flowchart in Excel is possible, but building it in Lucidchart and inserting it into your sheet is a simple two-step process.