How to Make a Data Flow Diagram in Word

3 min

Data flow diagrams (DFDs) come in handy when you need to visualize how data or information is passed between elements of a system. But DFDs are often large, complex, and difficult to build without software dedicated to that purpose.

Help others understand how your data is handled by mapping out the flow of information in any process or system with a clean, easy-to-follow diagram of your own. And if you’re wondering how to make a diagram in Word, you’re in the right place. This guide outlines instructions for two approaches to charting your own.

Option #1: Use Lucidchart to quickly add a data flow diagram directly into Microsoft Word 

Leverage Lucidchart’s integrations with Microsoft 365 to import a crisp, professional DFD into your document. It only takes a few minutes to set up the add-in! 

How to install the Lucidchart add-in for Microsoft Word 

First, you’ll need to download the Lucidchart add-on for Word. Follow these simple steps:

  1. Open a Microsoft Word document. 

  2. From the toolbar across the top of the editor, select File.

  3. Choose Get Add-ins.

  4. Click More Add-ins.

  5. Search “Lucid” in the store.

  6. Follow the prompts to finish the set-up.

How to insert a data flow diagram into Word with the add-in

Insert your DFD into Word as a high-resolution image using the Lucidchart add-in.  

  1. Open the Microsoft Word document you’d like to add the diagram to.

  2. From the toolbar across the top of the editor, choose Insert.

  3. Select My Add-ins.

  4. Choose the Lucidchart add-in and click Insert diagram.

  5. A window will pop up. Select Browse diagrams.

  6. If prompted, log into your Lucid account.

  7. From the panel that then appears, choose the diagram you’d like to add to your document. 

You can also create a new diagram to insert into your Word document. After completing steps 1-4 above, select Create new. This action will take you back to Lucidchart to create a new data flow diagram, either with a template or from scratch.

For additional help installing and using the Lucidchart add-in, visit our help center.

Option #2: Make a data flow diagram in Word using the shape library 

You can still make a diagram in Word from scratch. However, this option is time-consuming and requires manually organizing a lot of shapes, lines, and text.

How to make a diagram in Word using the shape library

  1. In Word, go to Insert. In the Illustrations section, select Shapes. A drop-down menu will appear. 

  2. Add shapes and lines to build your DFD. 

  3. Add text by returning to the Insert tab and selecting Text Box. Save your document. 

Lucidchart data flow diagram examples

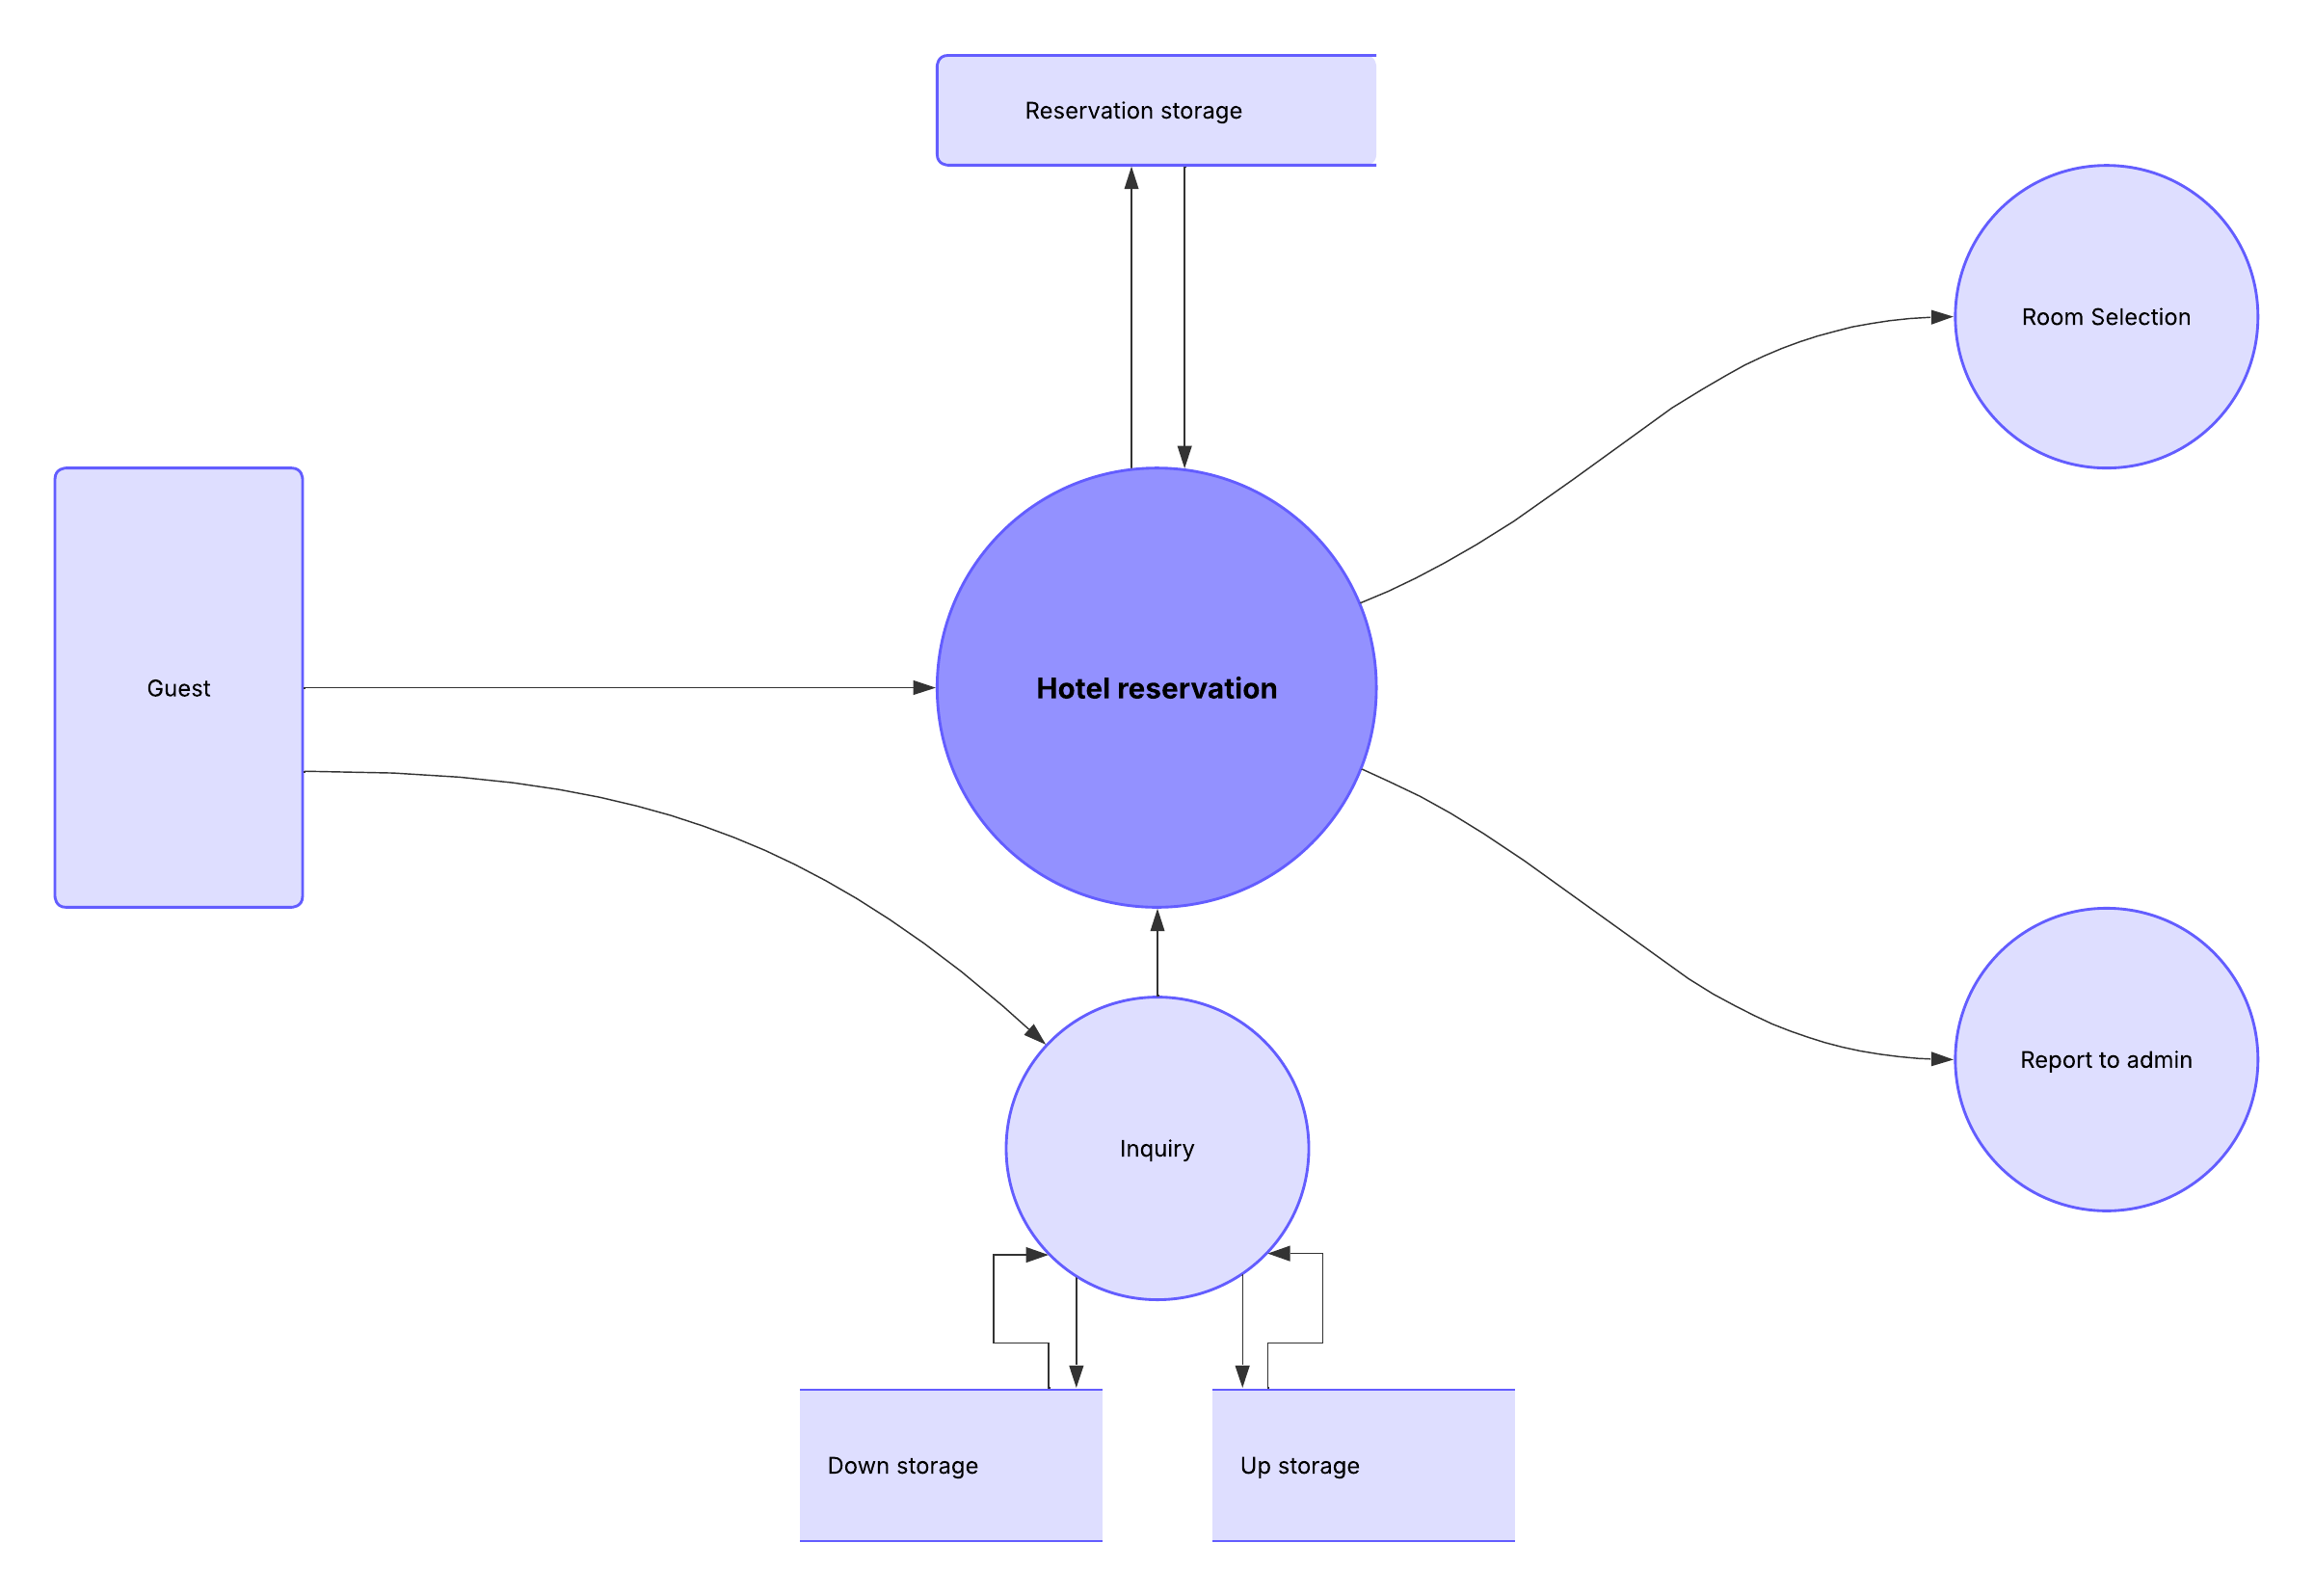
Save time and get started on the right foot when you give one of our data flow diagram templates a try. Just click one of the templates below to start diagramming.
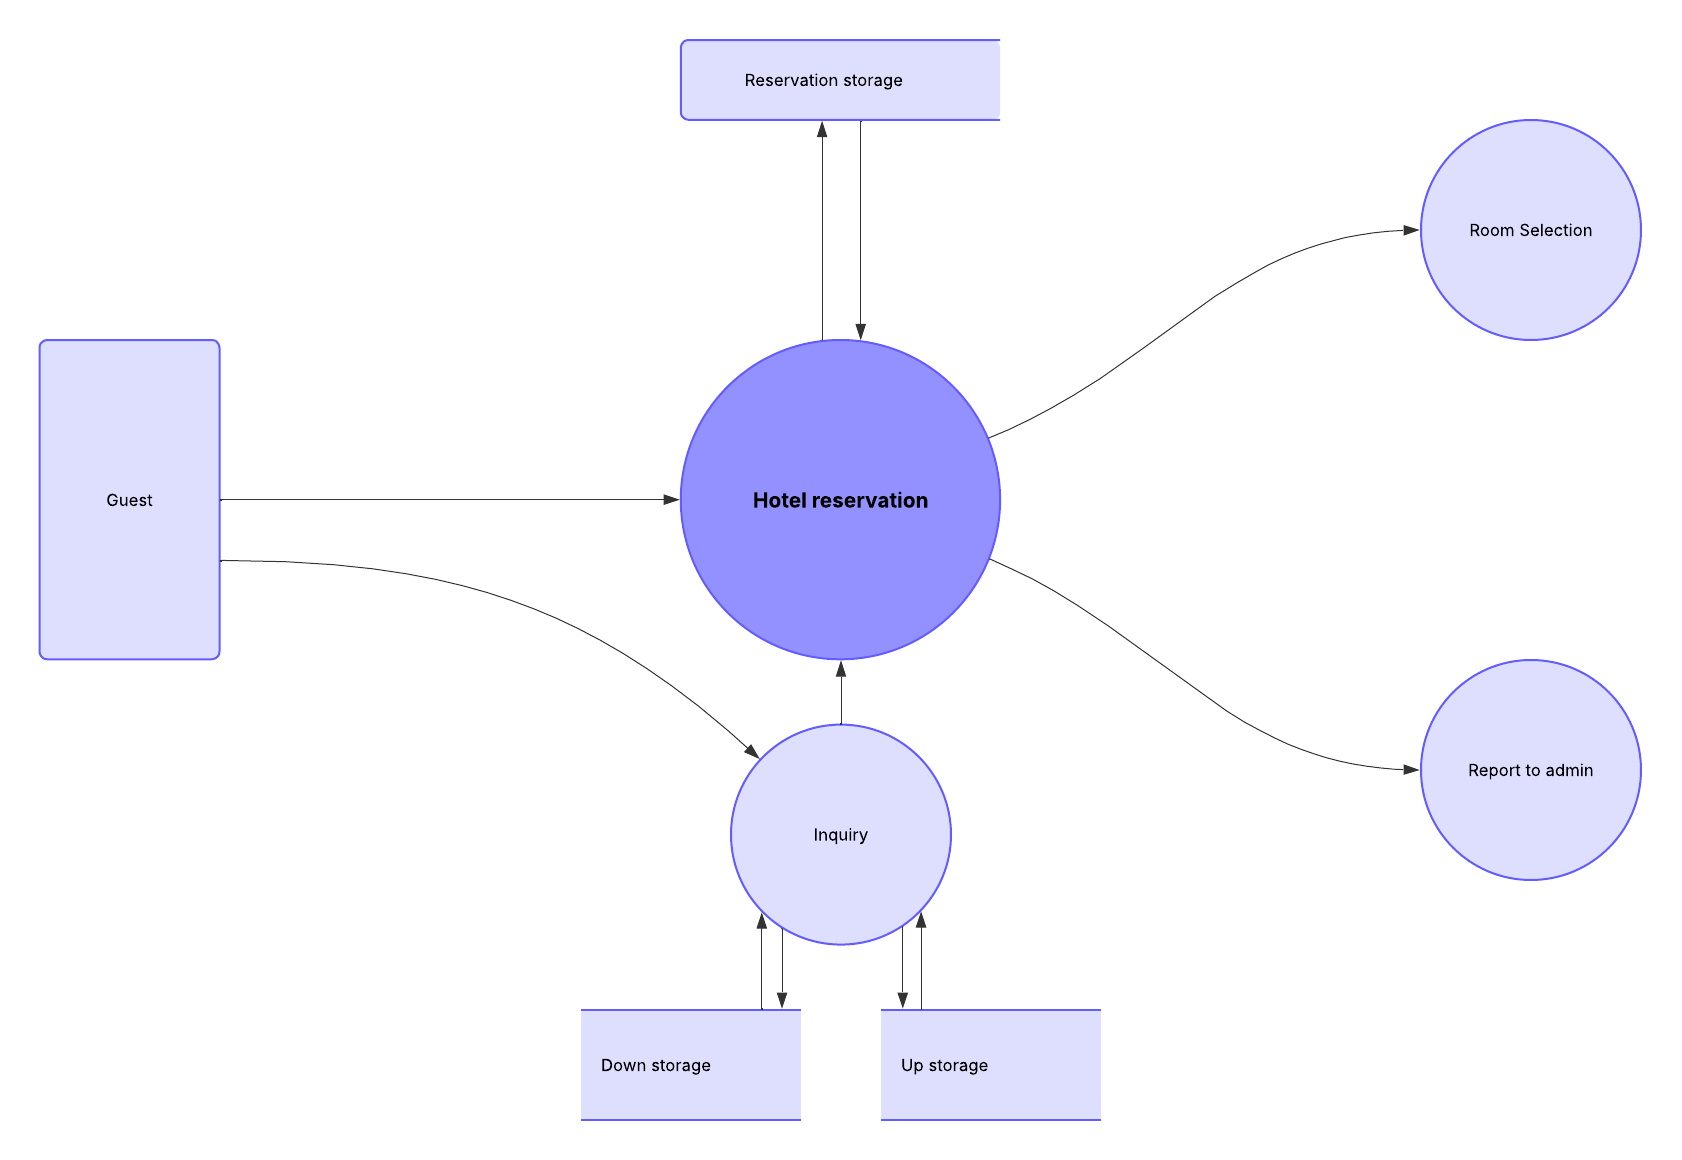
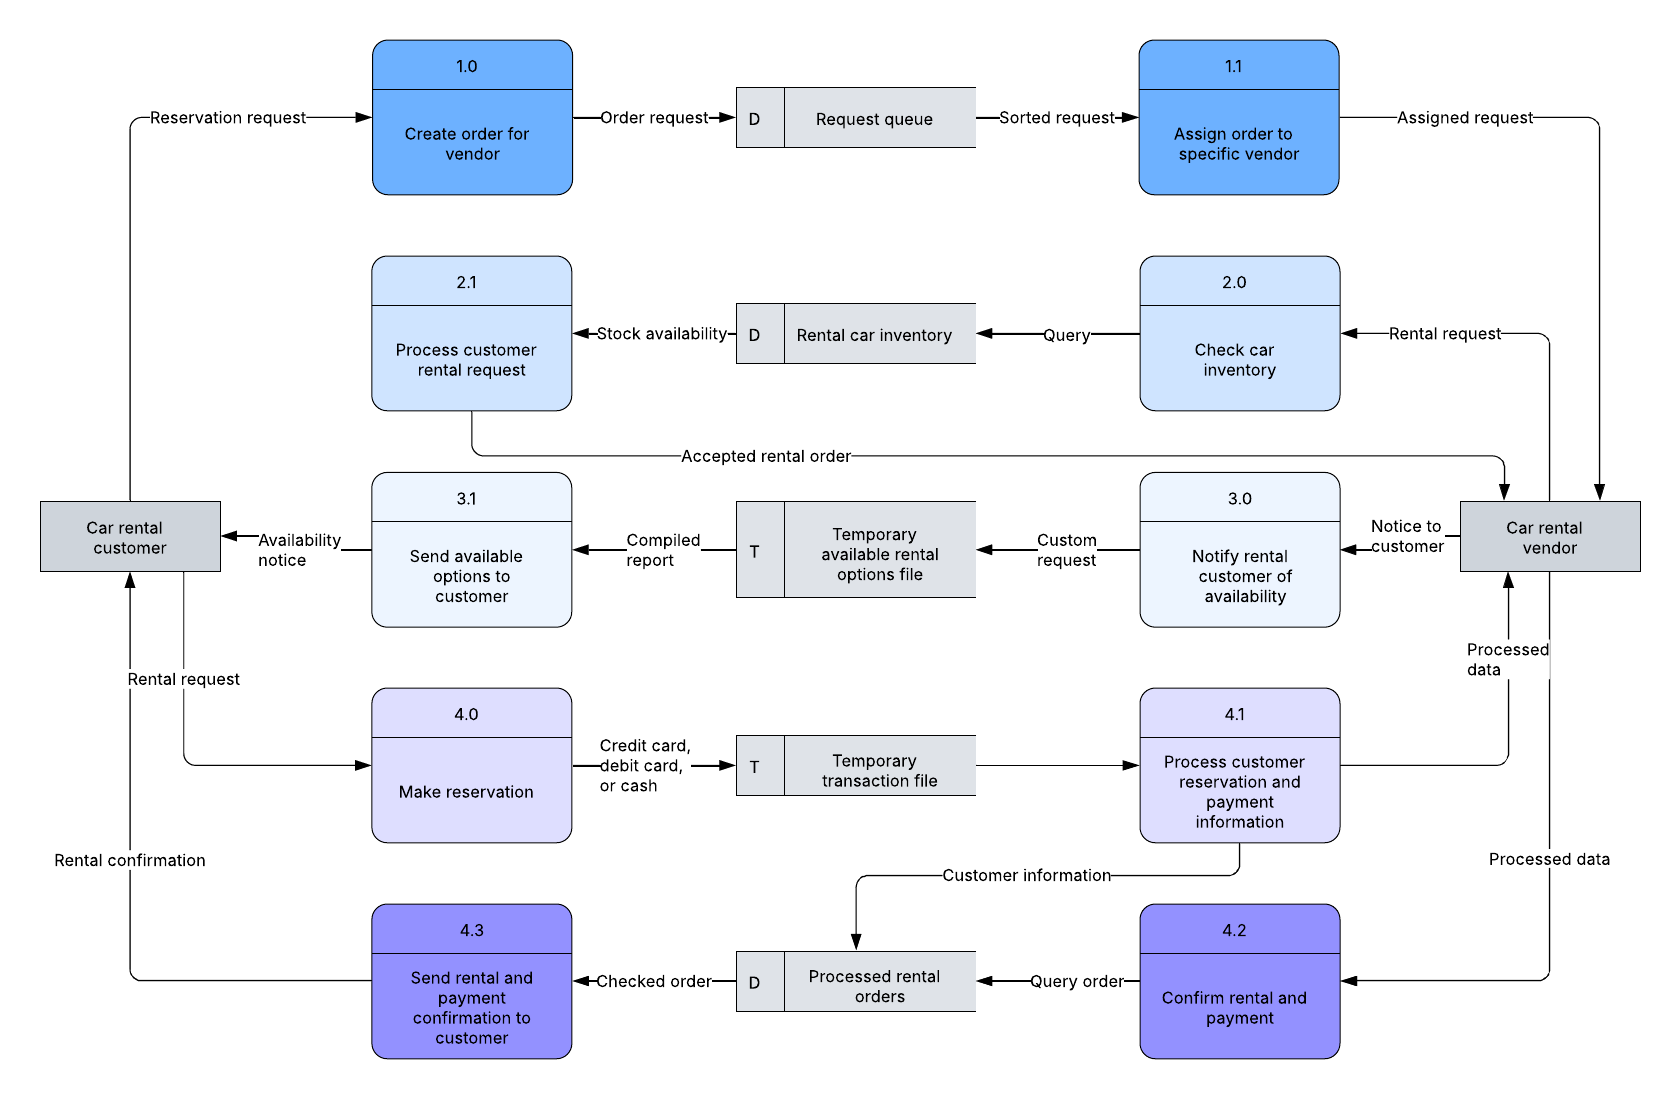
Map out the flow of a process or system with this Level 1 data flow diagram template, available with a paid account.
Try it out
Looking for a data flow diagram that can handle more complexity? Give this premium template a try.
Try it out
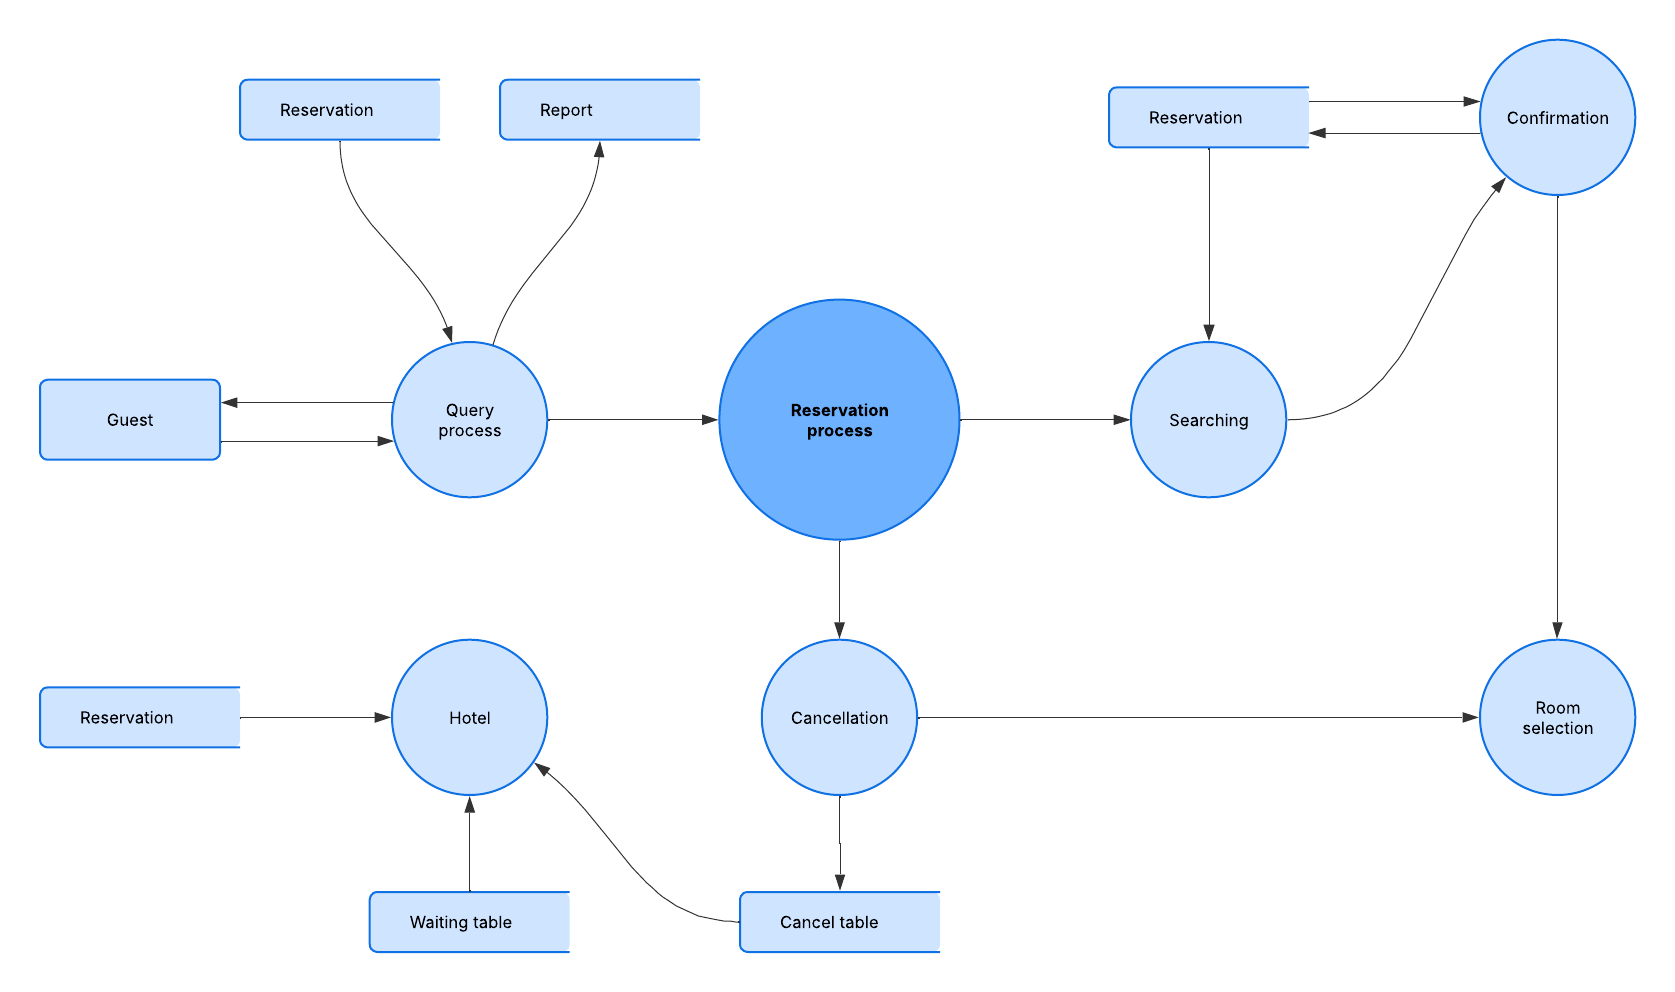
Explore this premium template for an example of a completed process data flow diagram.
Try it out

Avoid wasting time and patience trying to connect and align each shape, text box, or line—use Lucidchart instead. With hundreds of templates, easy-to-use tools, and an intuitive interface, Lucidchart helps you diagram like a pro from the start.

Explore all of our Microsoft 365 integrations that will help you simplify your workflow and boost productivity.

Learn more
Data flow diagram templates and examples

Use a template from our gallery to help you start work on your data flow diagram.

Data flow diagram: Level 1

Pricing:

Paid Account

Data flow diagram: Level 1, Pricing: Paid Account

Data flow diagram: Level 2

Pricing:

Paid Account

Data flow diagram: Level 2, Pricing: Paid Account

Data flow diagram (physical) example

Pricing:

Paid Account

Data flow diagram (physical) example, Pricing: Paid Account

Helpful resources

Data flow diagram software

Begin working on your DFD online in minutes with our intuitive data flow diagram maker.

Data flow diagram tutorial

This guide provides everything you need to know about data flow diagrams, including definitions, history, and symbols and notations

Data flow diagram symbols and notation

This guide takes a look at the primary components of data flow diagrams and the symbols used to represent them.

Frequently asked questions about data flow diagrams

A data flow diagram (DFD) maps out the flow of information for a process or system, using defined symbols to show data inputs, outputs, storage points, and the routes between them.

The key components of a DFD include external entities (data sources or destinations), processes (data transformations), data stores (where data is held), and data flows (the movement of data between components).

DFDs utilize symbols like rectangles, circles, and arrows, along with short text labels, to represent different elements such as processes, data stores, and external entities.

DFDs are organized hierarchically, starting with Level 0 (context diagram) for a high-level overview, followed by Level 1 for major subprocesses, and further levels for more detailed breakdowns.

A logical DFD focuses on the essential data flows required for business operations, while a physical DFD illustrates how the system is actually implemented, detailing the technical aspects.

DFDs are beneficial for software engineers, systems analysts, and business managers as they simplify complex systems, help identify inefficiencies, and clarify system requirements.

Yes, DFDs remain relevant because they help visualize system behavior, diagnose issues, and improve processes in various fields, including software engineering and business analysis.

You can create a DFD using Lucidchart, which offers templates and specialized notations to visually represent the flow of data through your system.

Everything you need to make a diagram

In addition to our online diagram maker, Lucidchart offers support and training resources to help you branch out to any type of diagram.

View training labs