Whether you’re creating a basic data flow diagram or an in-depth analysis with multiple levels, visualizing each element of a flow makes it easy to identify inefficiencies and produce the best system possible. Let’s take a look at the primary components of data flow diagrams and the symbols used to represent them.
What is a data flow diagram?
A data flow diagram (DFD) shows the way information flows through a process or system, including data inputs and outputs, data stores, and the various subprocesses that the data moves through. Together, they provide a graphical representation of the system, creating an easy-to-understand picture of what it does. DFDs are built using standardized symbols and notation to describe various entities and their relationships.
Read our full data flow diagrams overview to learn more about best practices when building DFDs.
Want to learn more about data flow diagrams watch this tutorial on how to make them:
Data flow diagram levels
Data flow diagrams are also categorized by level. The most basic DFDs are Level 0, and the level number increases depending on how complex the diagram is.
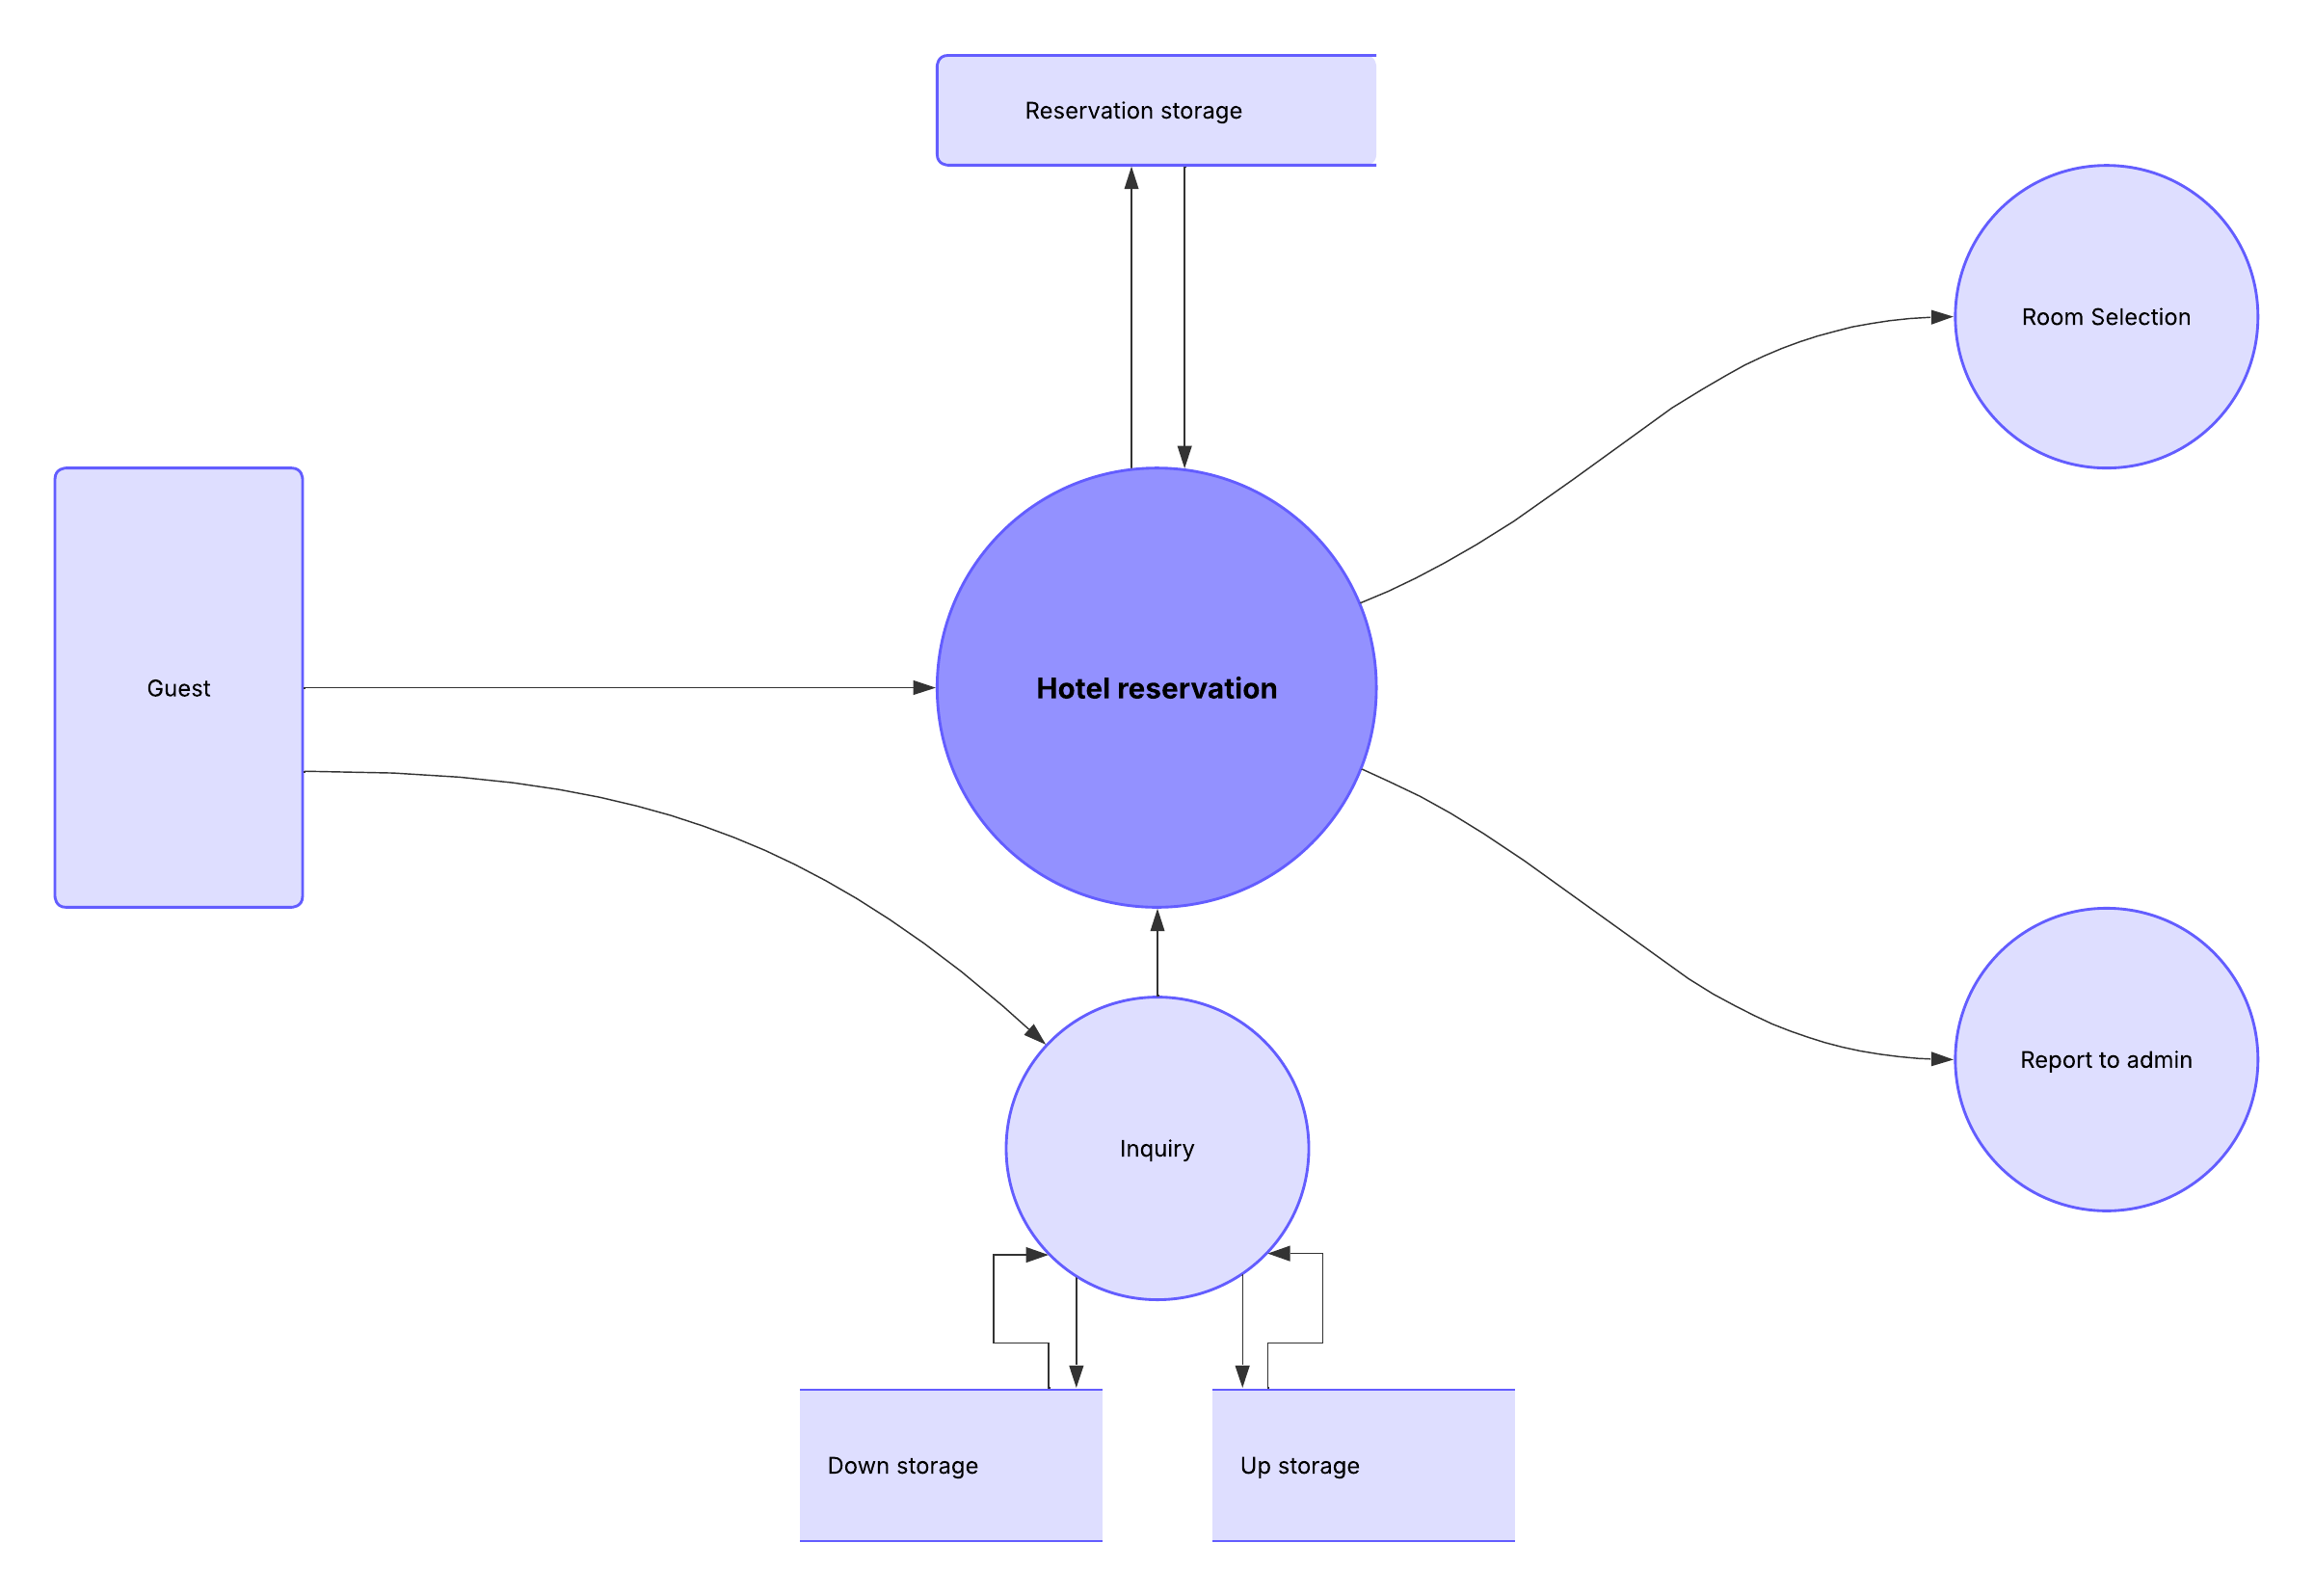
Level 0 DFDs, also known as context diagrams, are the most basic data flow diagrams. They provide a broad view that is easily digestible with little detail. Level 0 data flow diagrams show a single process node and its connections to external entities.
Level 1 DFDs are still a general overview, but they go into more detail than a context diagram. In a Level 1 DFD, the single process node from the context diagram is broken down into sub-processes. As these processes are added, the diagram will need additional data flows and data stores to link them together.
Level 2+ DFDs simply break processes down into more detailed sub-processes. In theory, DFDs could go beyond Level 3, but they rarely do. Level 2+ data flow diagrams are detailed enough that it doesn’t usually make sense to break them down further.
Data flow diagram notations and symbols
The two main types of notation used for data flow diagrams are Yourdon-Coad and Gane-Sarson. These types are both named after their creators, all experts who helped develop DFD methodology: Ed Yourdon, Peter Coad, Chris Gane, and Trish Sarson.
There are some differences in style between the notation types. For example, Yourdon and Coad notation uses circles to represent processes, while Gane and Sarson notation uses rectangles with rounded corners. Another variation is the symbol used for data stores. Yourdon and Coad notation uses parallel lines while Gane and Sarson notation uses an open-ended rectangle.
Because DFD symbols vary, it’s important to be consistent with whatever notation you choose in order to avoid confusion. If you’re using DFD software, it will likely dictate which set of symbols is available to use.
All data flow diagrams include four main elements: entity, process, data store, and data flow.
External entity: Also known as actors, sources or sinks, and terminators, external entities produce and consume data that flows between the entity and the system being diagrammed. These data flows are the inputs and outputs of the DFD. Since they are external to the system being analyzed, these entities are typically placed at the boundaries of the diagram.
Process: A process is classified as any activity that changes data flows. Since they transform incoming data to outgoing data, all processes must have inputs and outputs on a DFD. This symbol is given a simple name based on its function, such as “Ship Order,” rather than being labeled “process” on a diagram. In Gane-Sarson notation, a rectangular box is used and may be labeled with a reference number, the location in the system where the process occurs, and a short title that describes its function. Processes are typically oriented from top to bottom and left to right on a data flow diagram.
Data store: A data store does not generate any operations but simply holds data for later access. Data stores could consist of files held long-term or a batch of documents stored briefly while they wait to be processed. Input flows to a data store include information or operations that change the stored data. Output flows would be data retrieved from the store.
Data flow: Movement of data between external entities, processes, and data stores is represented with an arrow symbol, which indicates the direction of flow. This data could be electronic, written, or verbal. Input and output data flows are labeled based on the type of data or its associated process or data store, and this name is written alongside the arrow.
| Yourdon and Coad | Gane and Sarson | |
| External entity |  |  |
| Process |  |  |
| Data store |  |  |
| Data flow |  |  |
How to draw a data flow diagram
Lucidchart streamlines the design process, making it easy to create a customized data flow diagram using intuitive templates. Simply drag and drop the industry-standard symbols you need from our library directly onto your document to map out even the most complex systems. As a cloud-native platform, Lucidchart enables your team to collaborate in real time and maintain a source of truth for your system architecture.
With Lucidchart, you can easily create a data flow diagram online. Customize your diagram and then share it with others.
Want to make a DFD of your own? Try Lucidchart. It's quick, easy, and completely free.
Make a DFD