Key takeaways
A data flow diagram (DFD) maps how information moves through a system using four components: external entities, processes, data stores, and data flows.
DFDs communicate clearly to technical and non-technical audiences, making them useful for marketers, business analysts, and software engineers alike.
Unlike a flowchart, a DFD has no control flow, so it contains no decision rules, conditions, or loops.
Data flow diagram levels progress from Level 0 (a context diagram) to Level 1 and Level 2, adding detail at each stage.
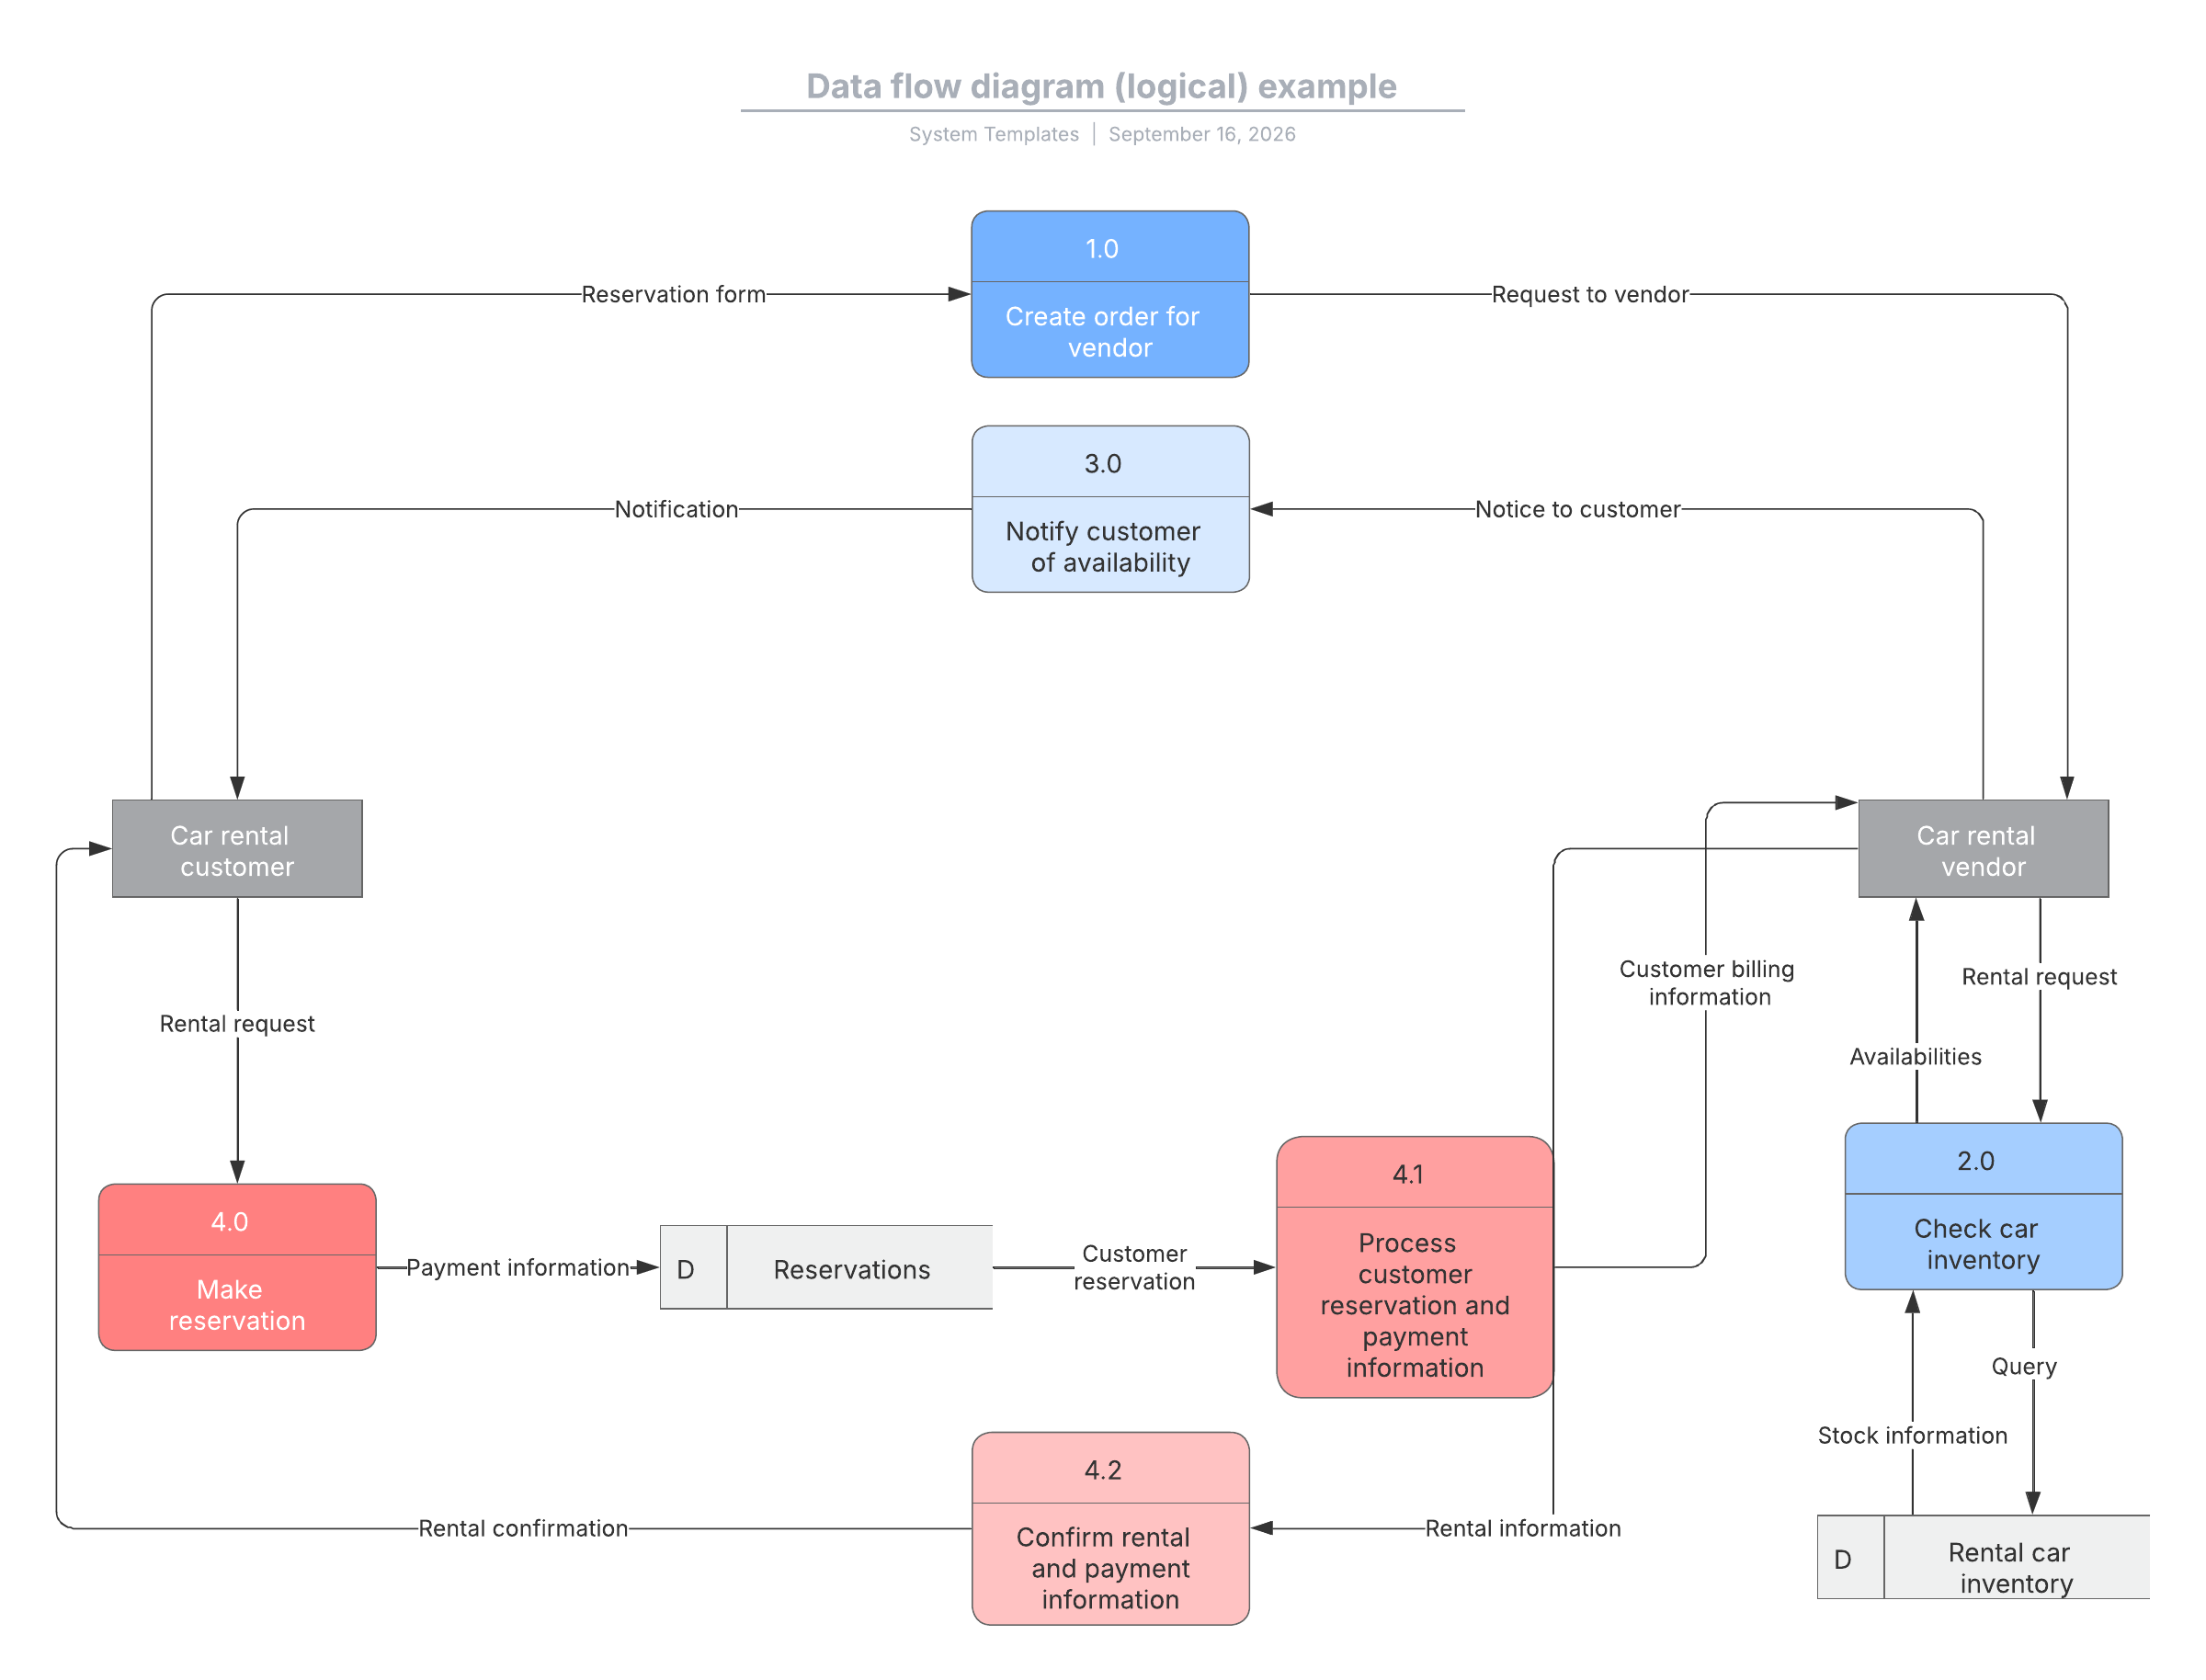
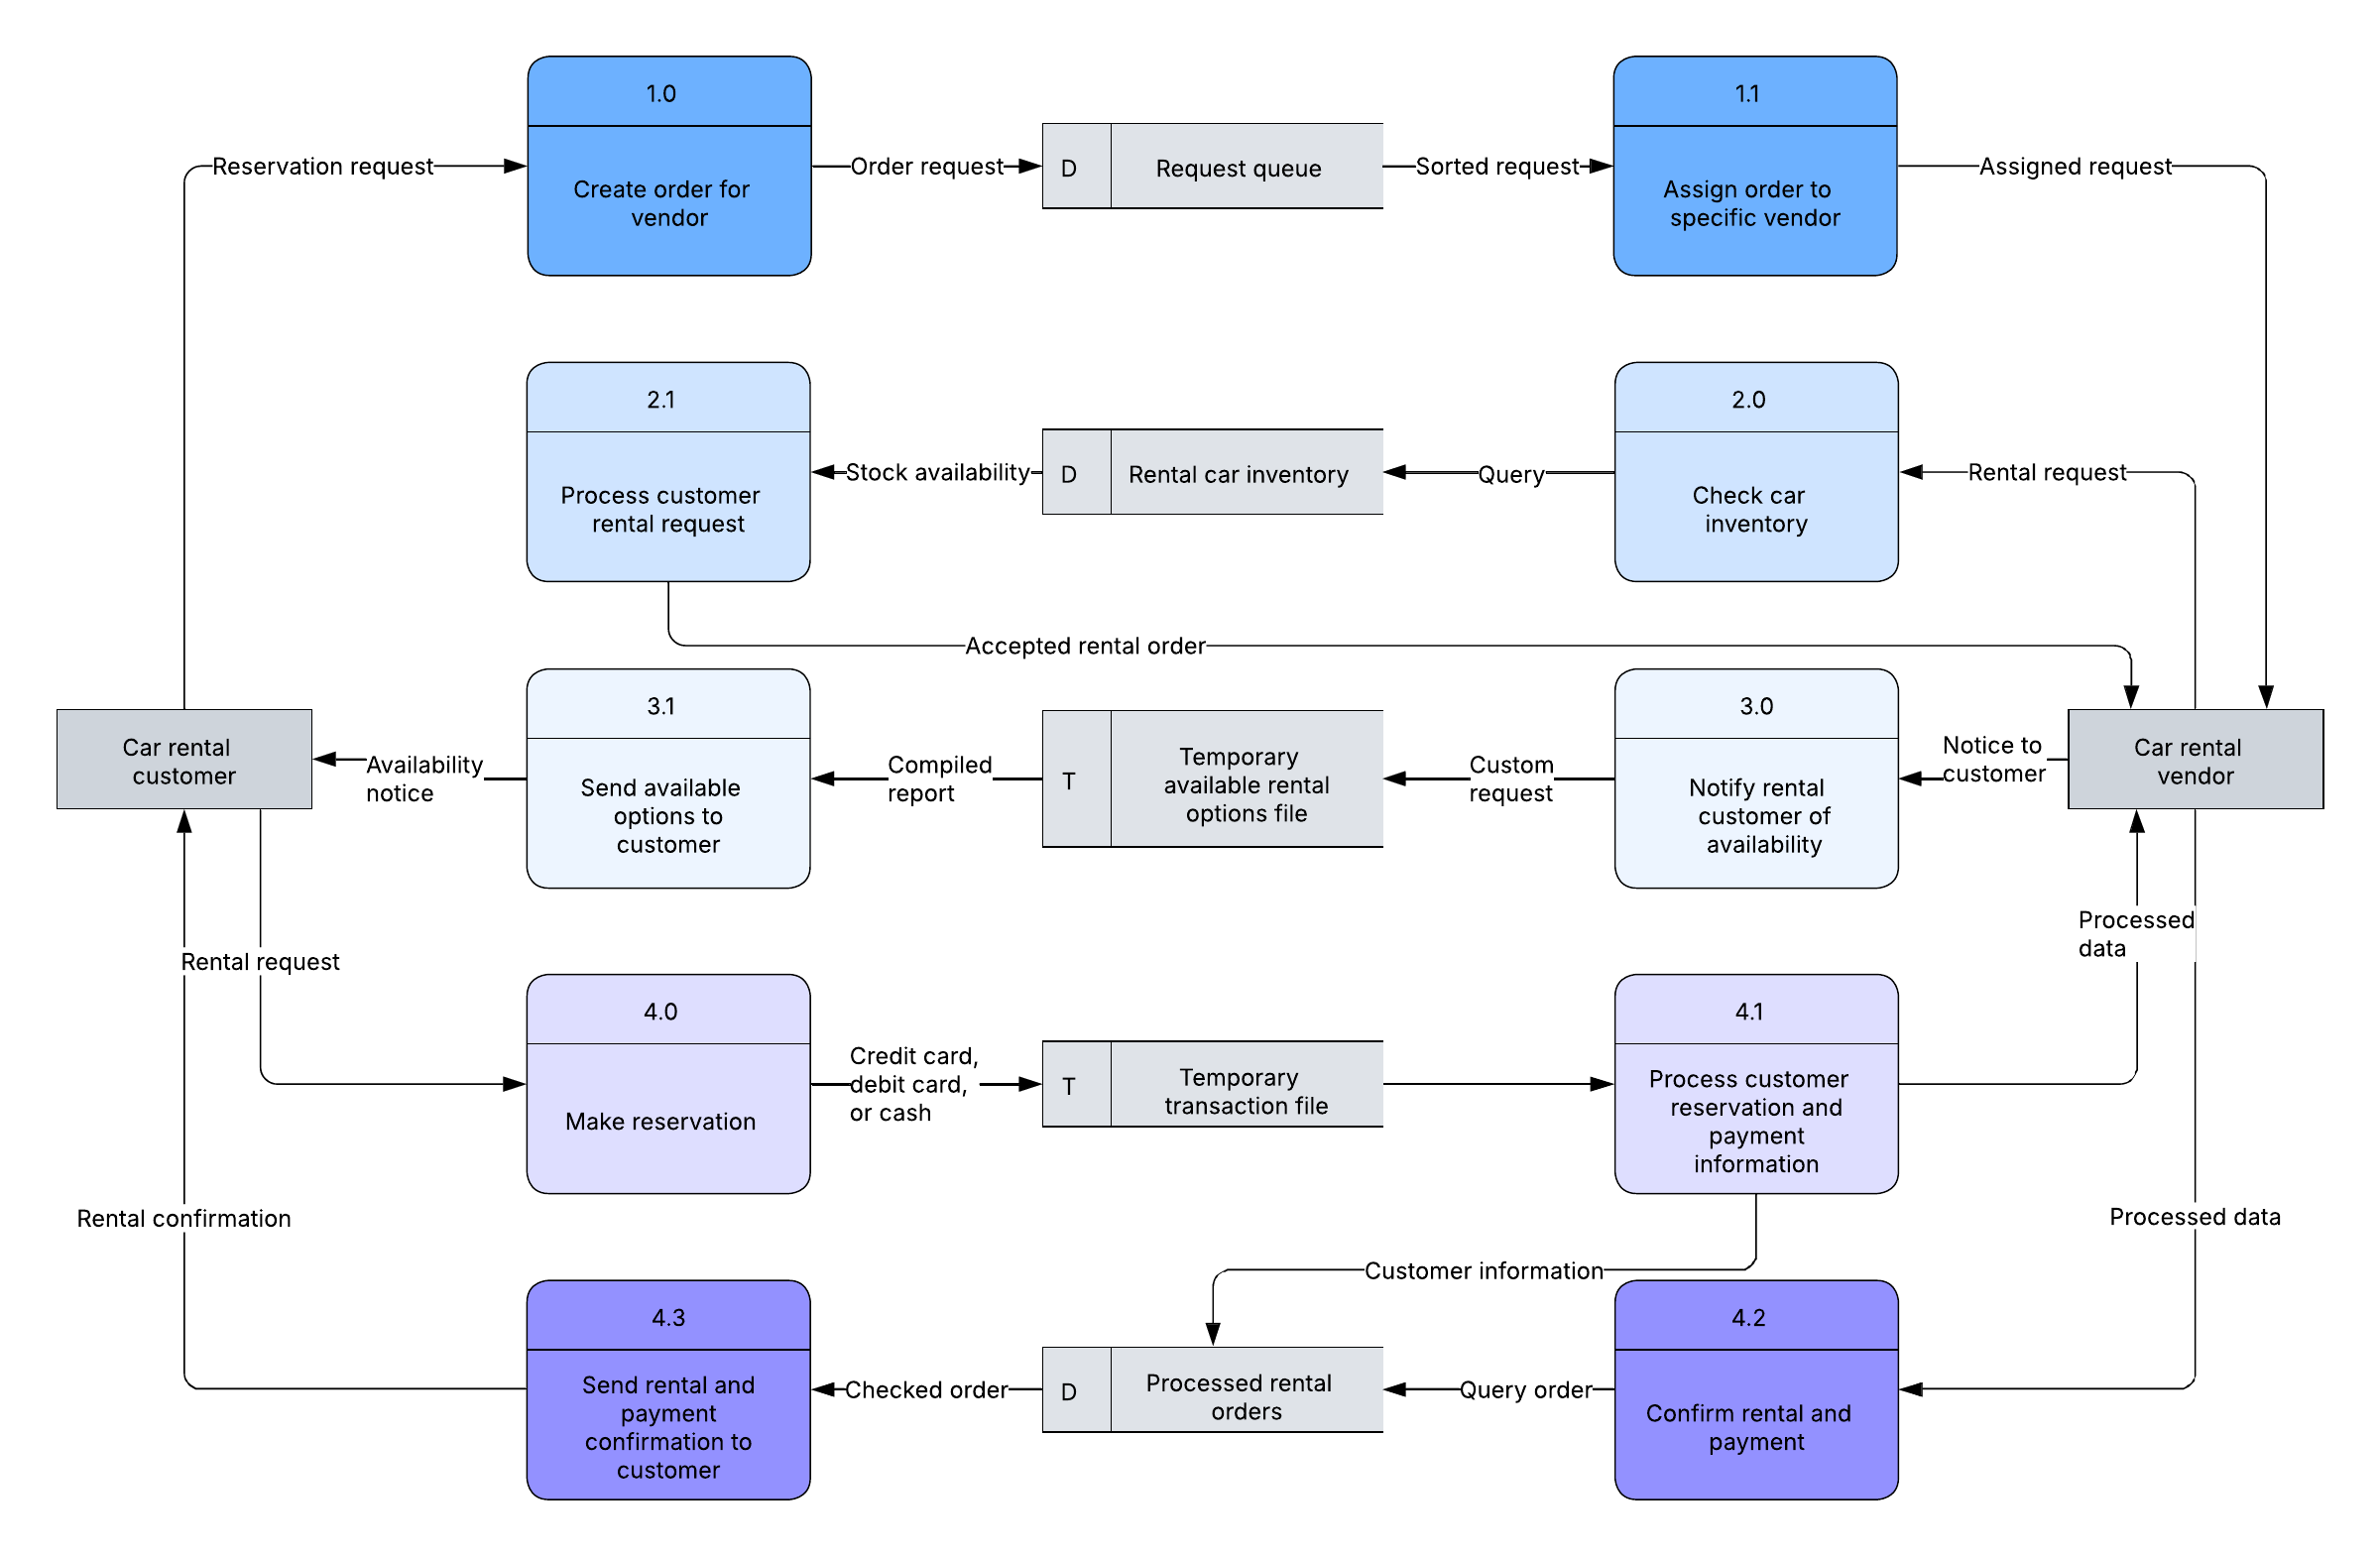
A logical DFD describes what a system does, while a physical DFD describes how the system is or will be implemented.
You can build one online with a data flow diagram maker like Lucidchart, manually, through Lucid AI, or with a ready-made template.
As you build and optimize systems at work, a data flow diagram (DFD) helps you visualize how information moves and spot inefficiencies. It also aligns stakeholders on how work actually gets done.
This guide covers the definition, history, symbols, rules, and levels of a DFD. You'll also learn the difference between logical and physical DFDs and how to build one in minutes.
What is a data flow diagram?
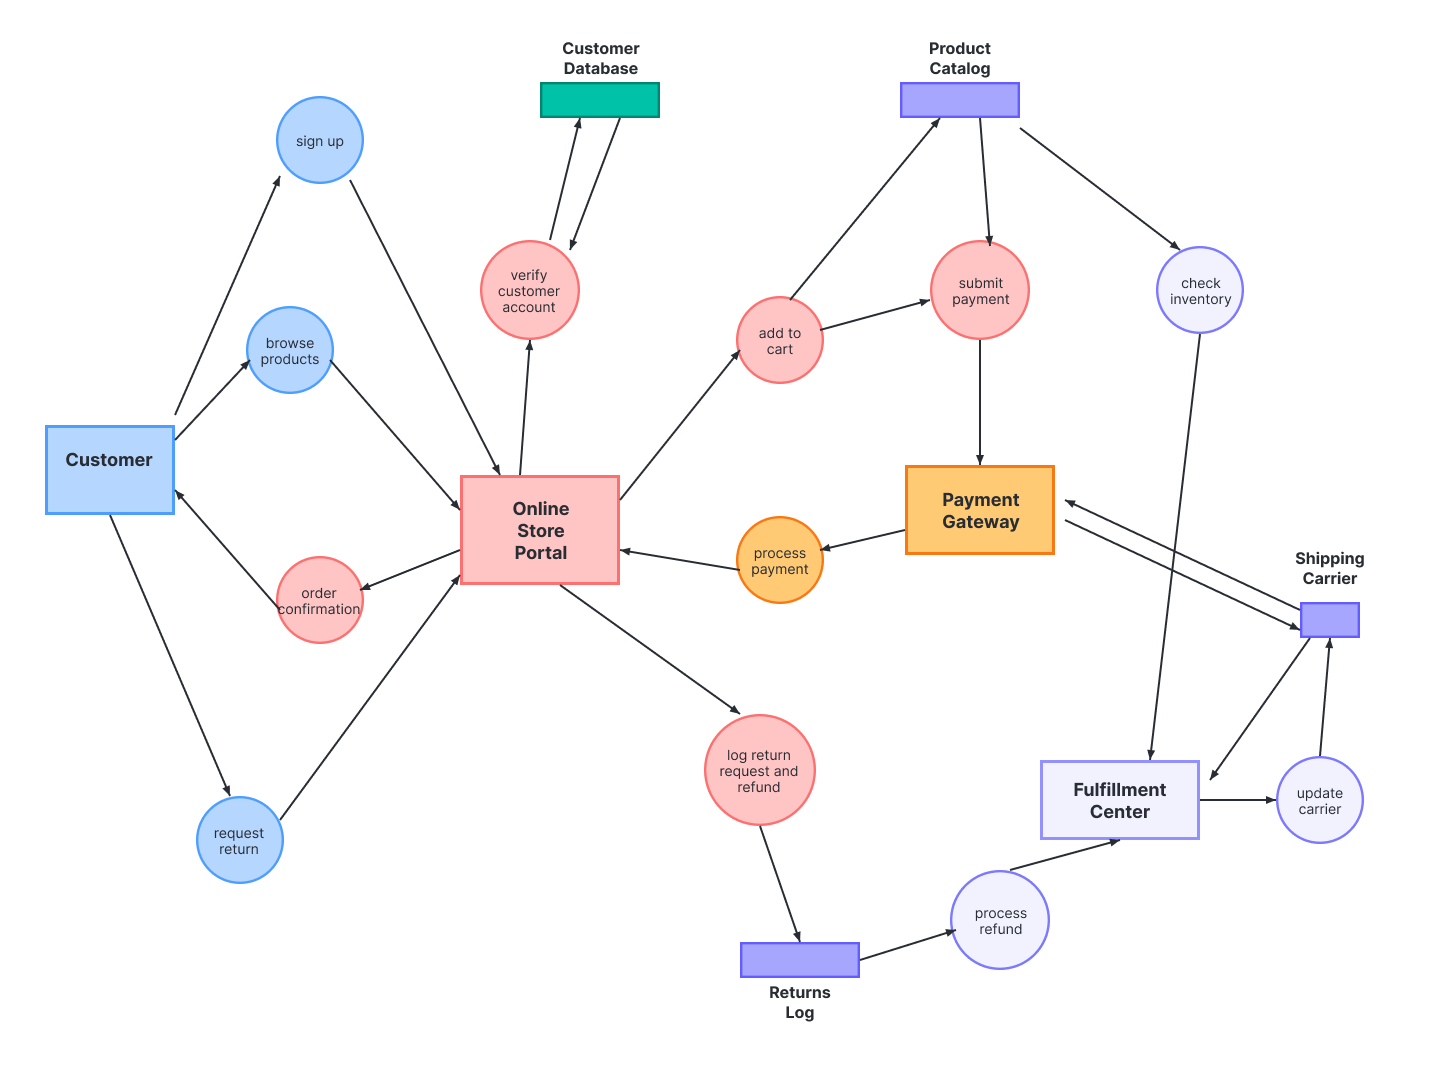
A data flow diagram maps the flow of information for any process or system. It uses defined symbols like rectangles, circles, and arrows, along with short text labels. Together, they show data inputs, outputs, storage points, and the routes between them.
An effective DFD can visually convey what would be hard to explain in words. It works for both technical and non-technical audiences, from a developer to CEO. Diagrams range from simple, hand-drawn overviews to in-depth, multi-level DFDs.
Because DFDs make system behavior visible, teams use them to diagnose where breakdowns and bottlenecks originate.
The history of data flow diagrams
DFD notation draws on graph theory and grew out of the structured analysis and design methods of the mid-1970s. Larry Constantine first proposed the approach, building on the data flow graph computation models of David Martin and Gerald Estrin.
Ed Yourdon then popularized data flow diagrams, and he and Constantine detailed the structured design approach in their 1979 book, Structured Design. Both the structured design concept and the DFD method gained wide adoption across software engineering and business.
Tom DeMarco, Chris Gane, and Trish Sarson advanced the method further. They worked in various combinations to define the symbols and notations still used in a DFD today.
What symbols are used in a DFD?
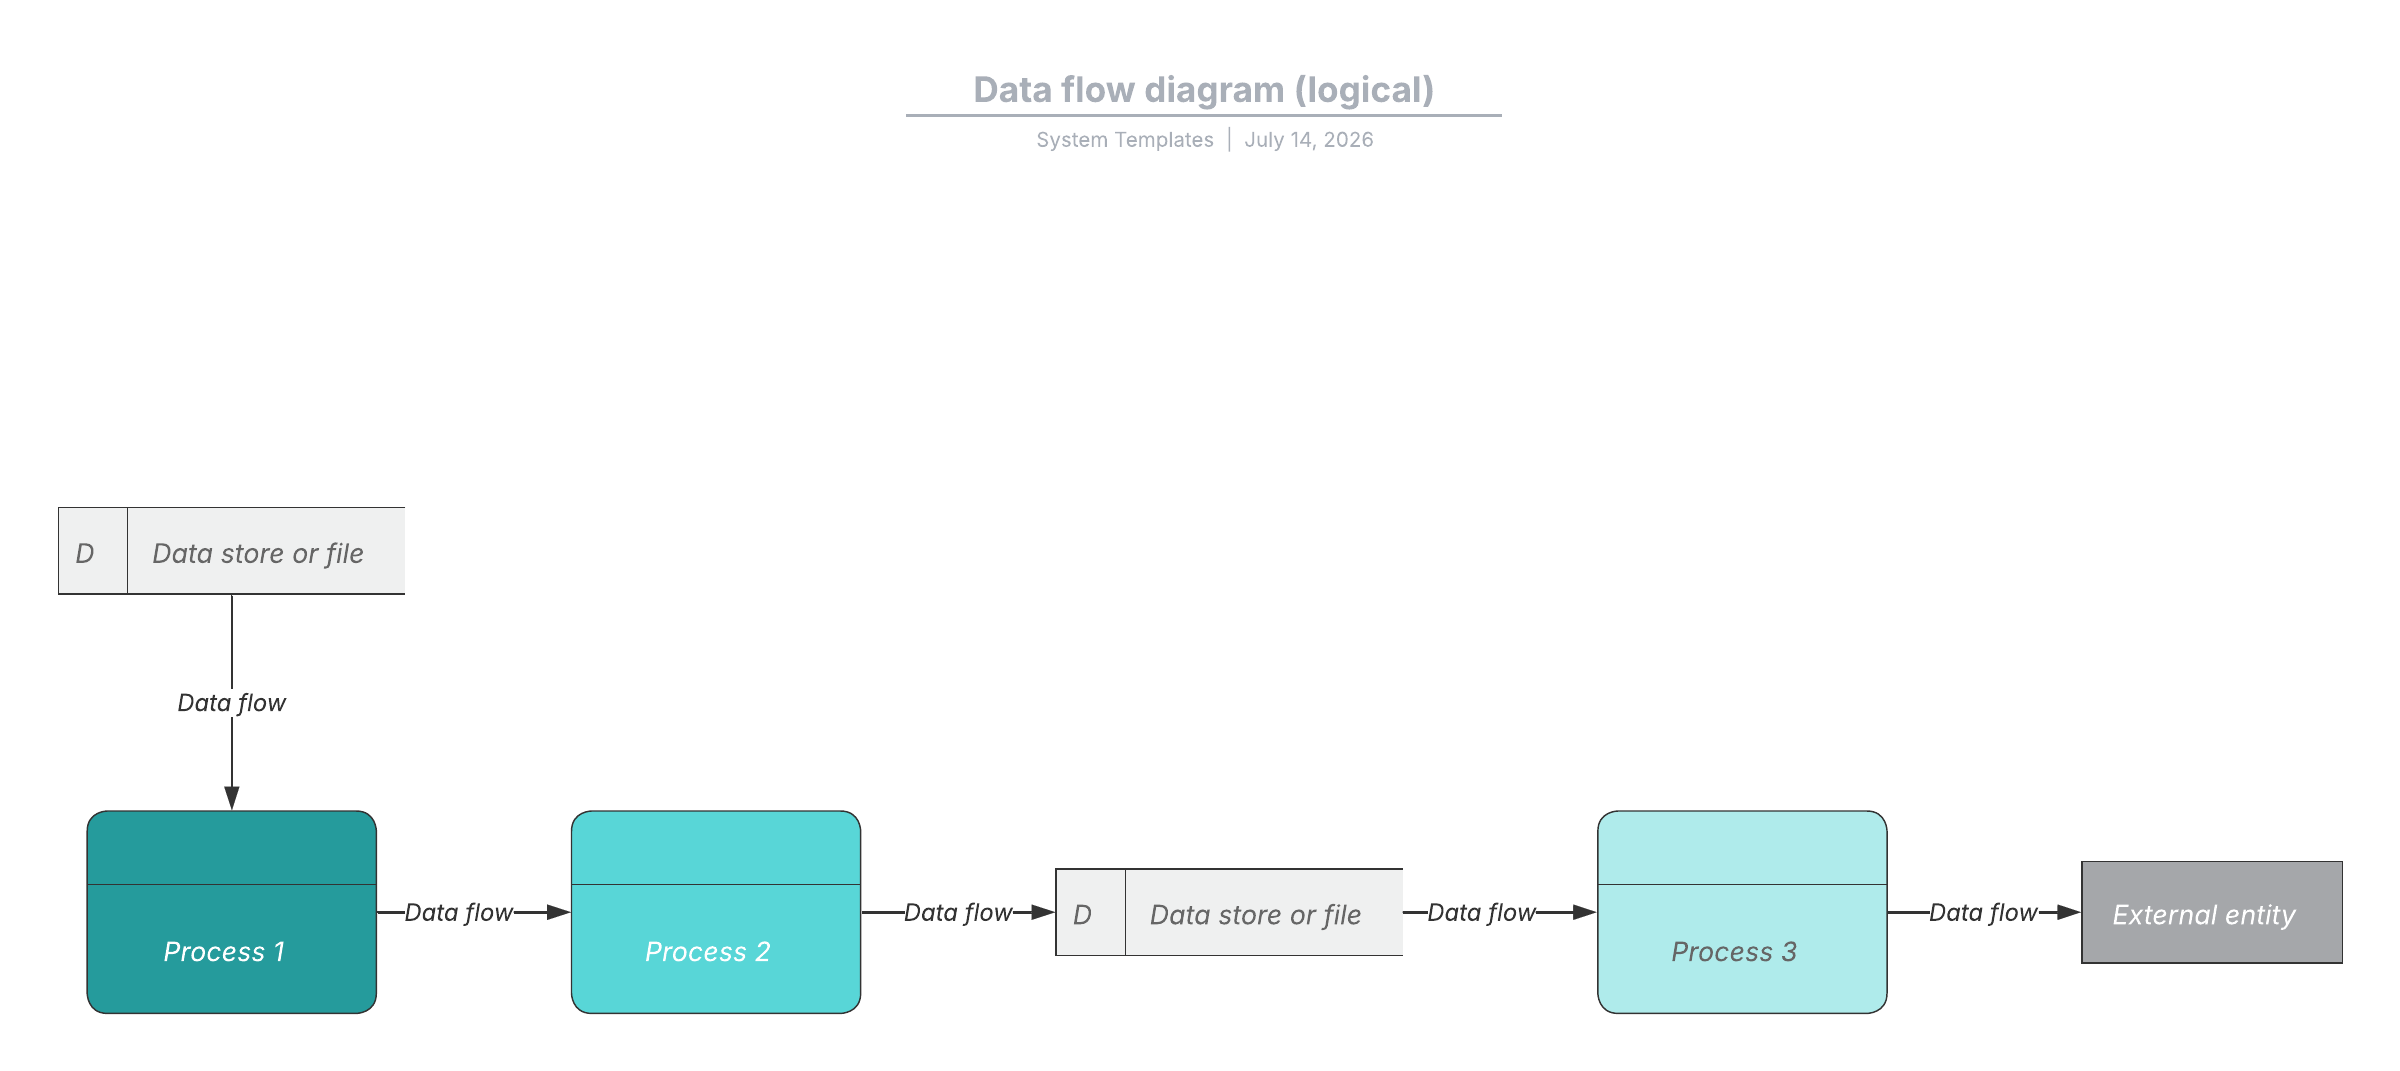
A DFD uses four core components/symbols: external entities, processes, data stores, and data flows. It’s a good idea to familiarize yourself with the standard data flow diagram symbols before you start creating one, but keep in mind, notation varies slightly between systems.
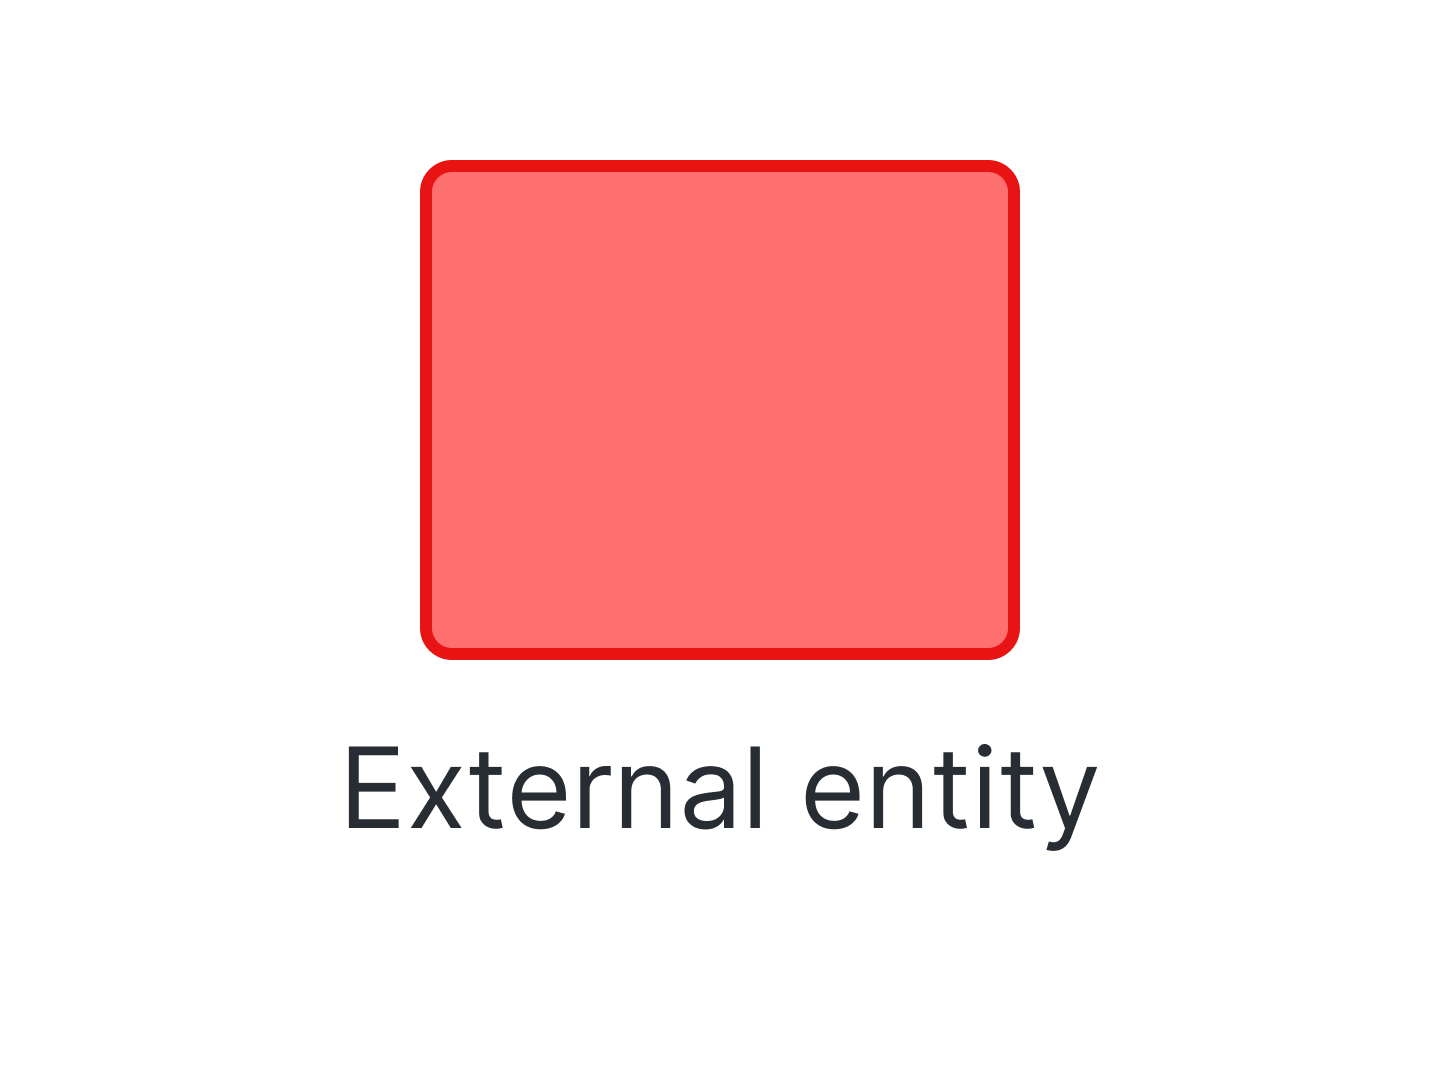
External entity: A system that sends or receives data, also called a terminator, source, sink, or actor, drawn on the edges of the diagram
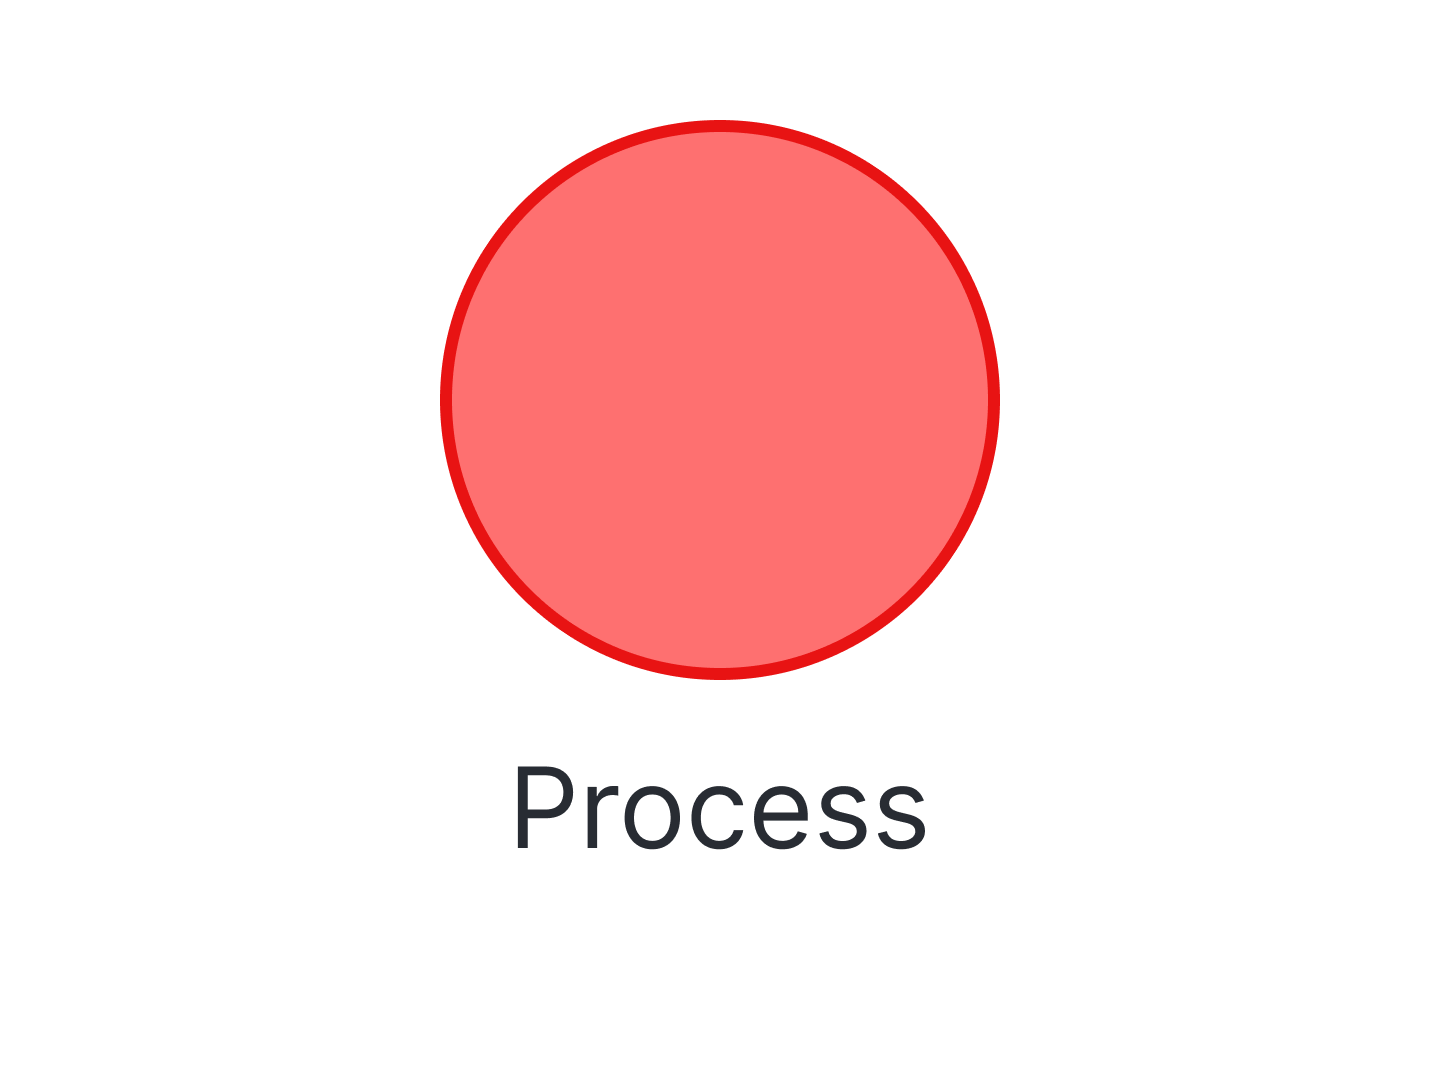
Process: An action that changes data and produces an output with a short verb label, such as "submit payment"
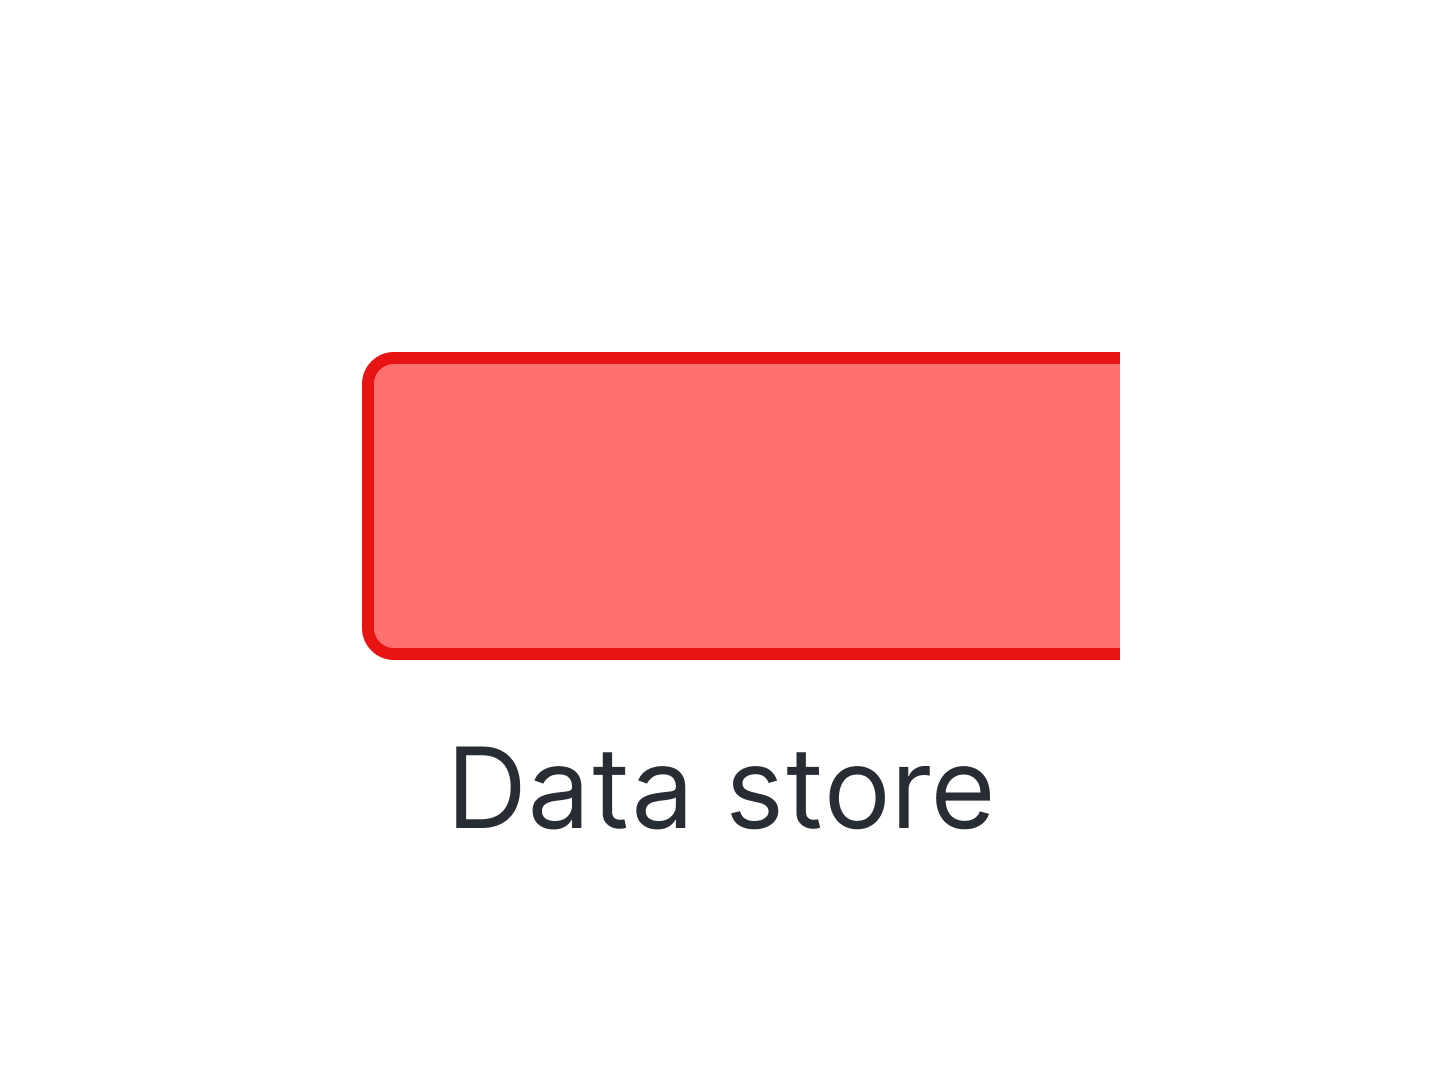
Data store: A file or repository that holds information for later use, such as a database table, given a simple noun label, such as "orders"
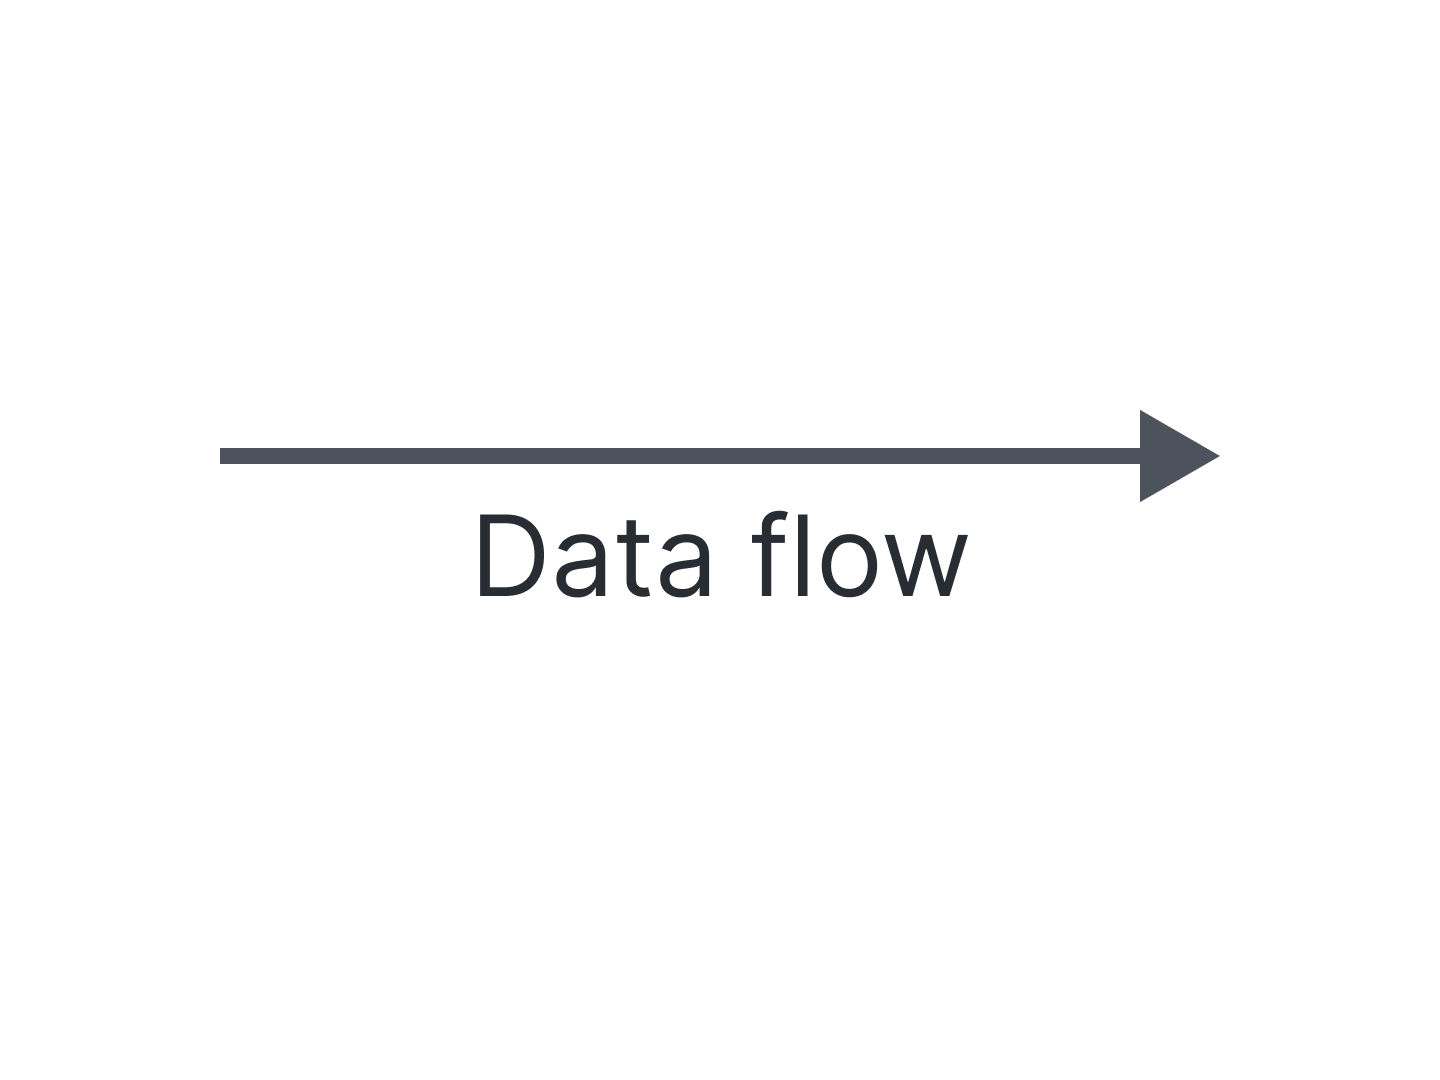
Data flow: The route that data takes between entities, processes, and stores, shown with an arrow labeled with a short data name like "billing details"
Rules for creating a DFD
A few rules keep a DFD accurate and readable. Follow them to make sure every element connects logically to the rest of the system.
Each process should have at least one input and one output.
Each data store should have at least one data flow in and one out.
Data stored in a system must move through a process.
Every process must lead to another process or a data store.
Unlike a flowchart, a DFD has no control flow. It shows no decision rules, conditions, or loops, so it captures what data moves where rather than the order in which steps run.
What are the levels of a data flow diagram?
Data flow diagram levels are numbered 0, 1, and 2, and occasionally extend to Level 3 or beyond. Each level adds detail, moving from a single-glance overview to a granular view of individual processes.
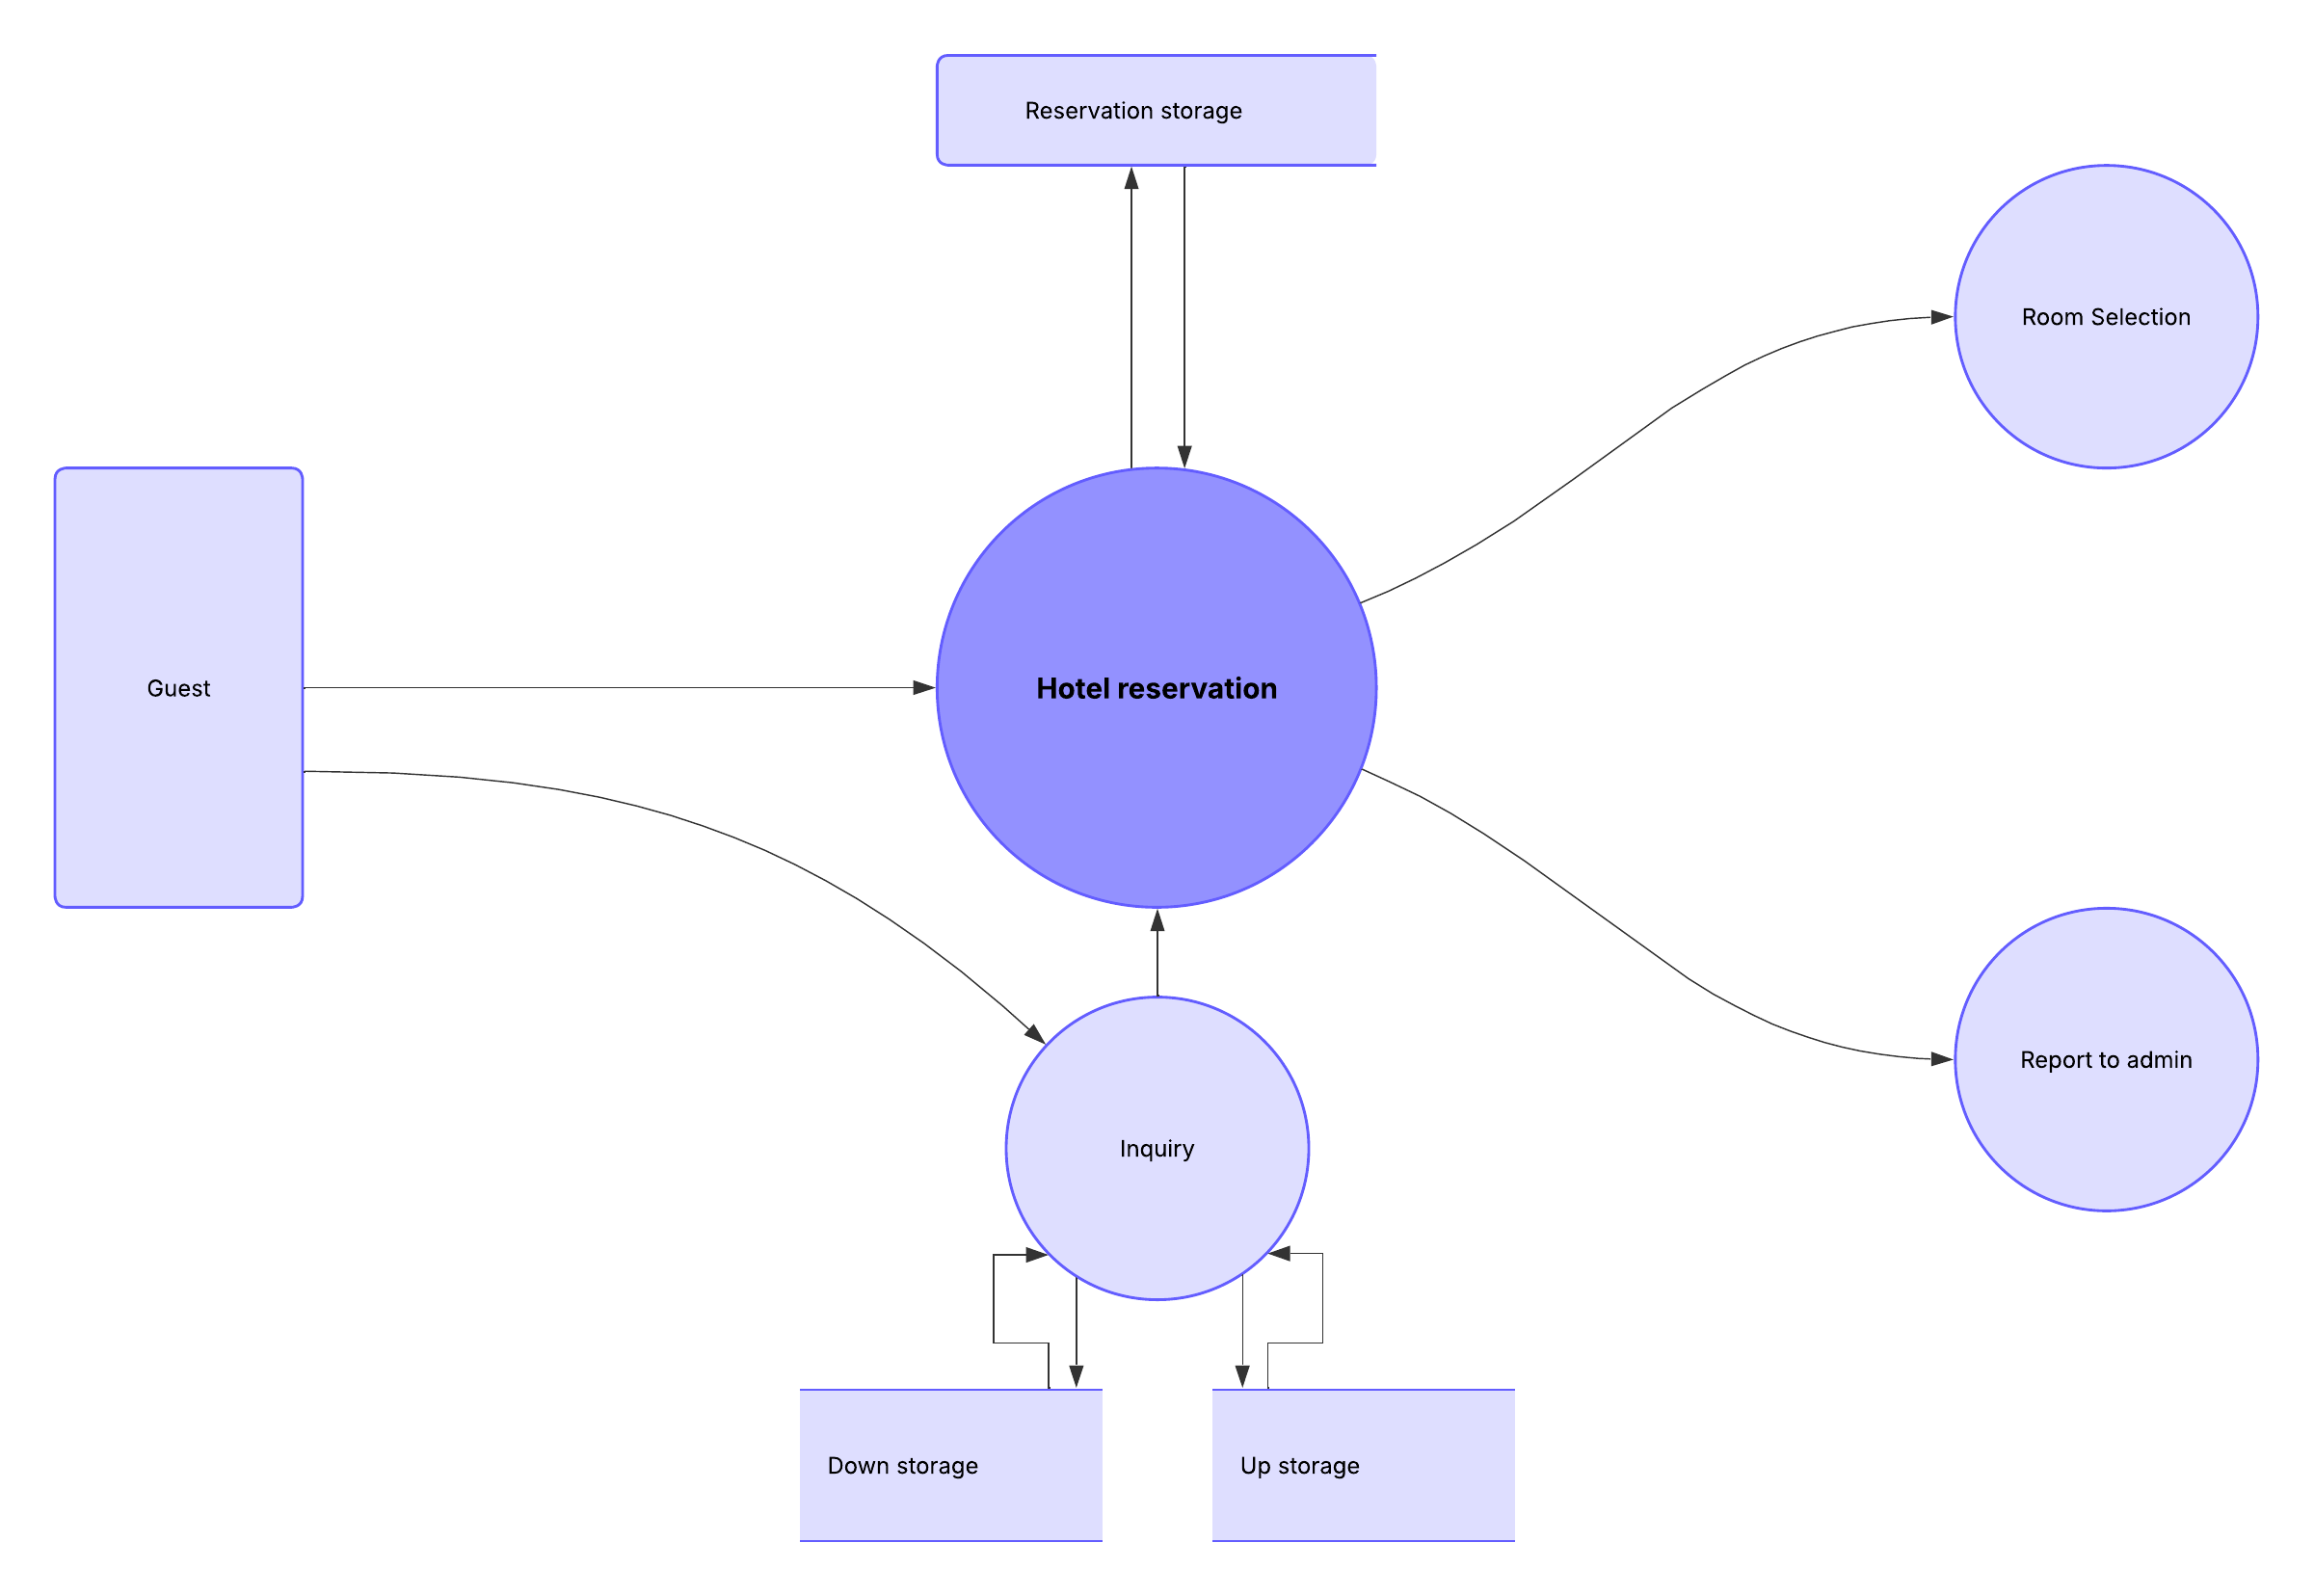
DFD Level 0
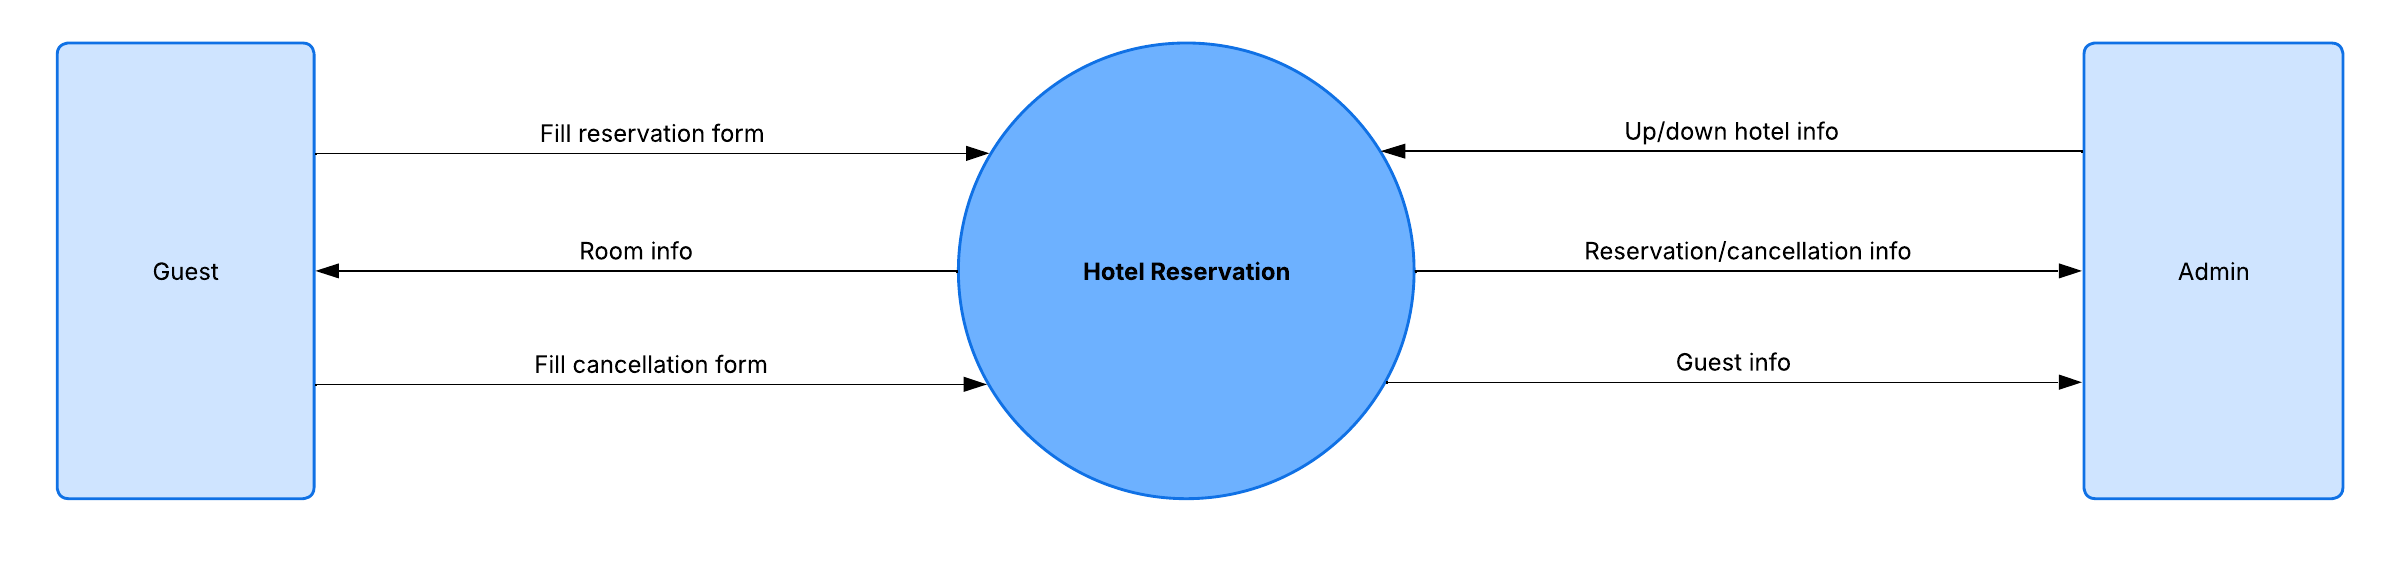
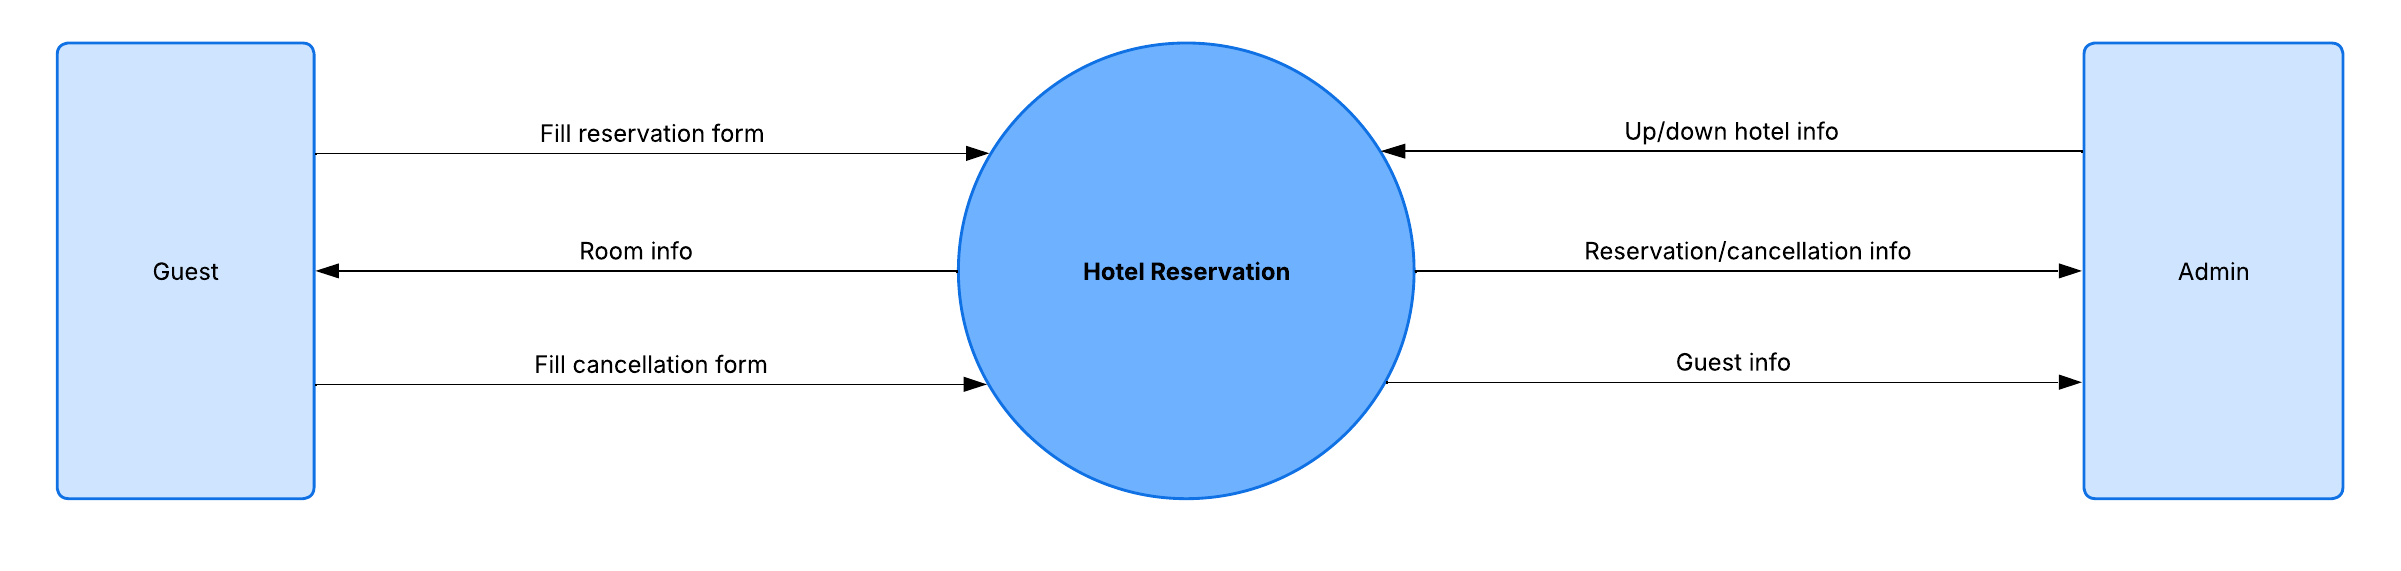
Also called a context diagram, Level 0 shows a whole system as one high-level process and its relationships with external entities. It gives stakeholders a fast, big-picture view.
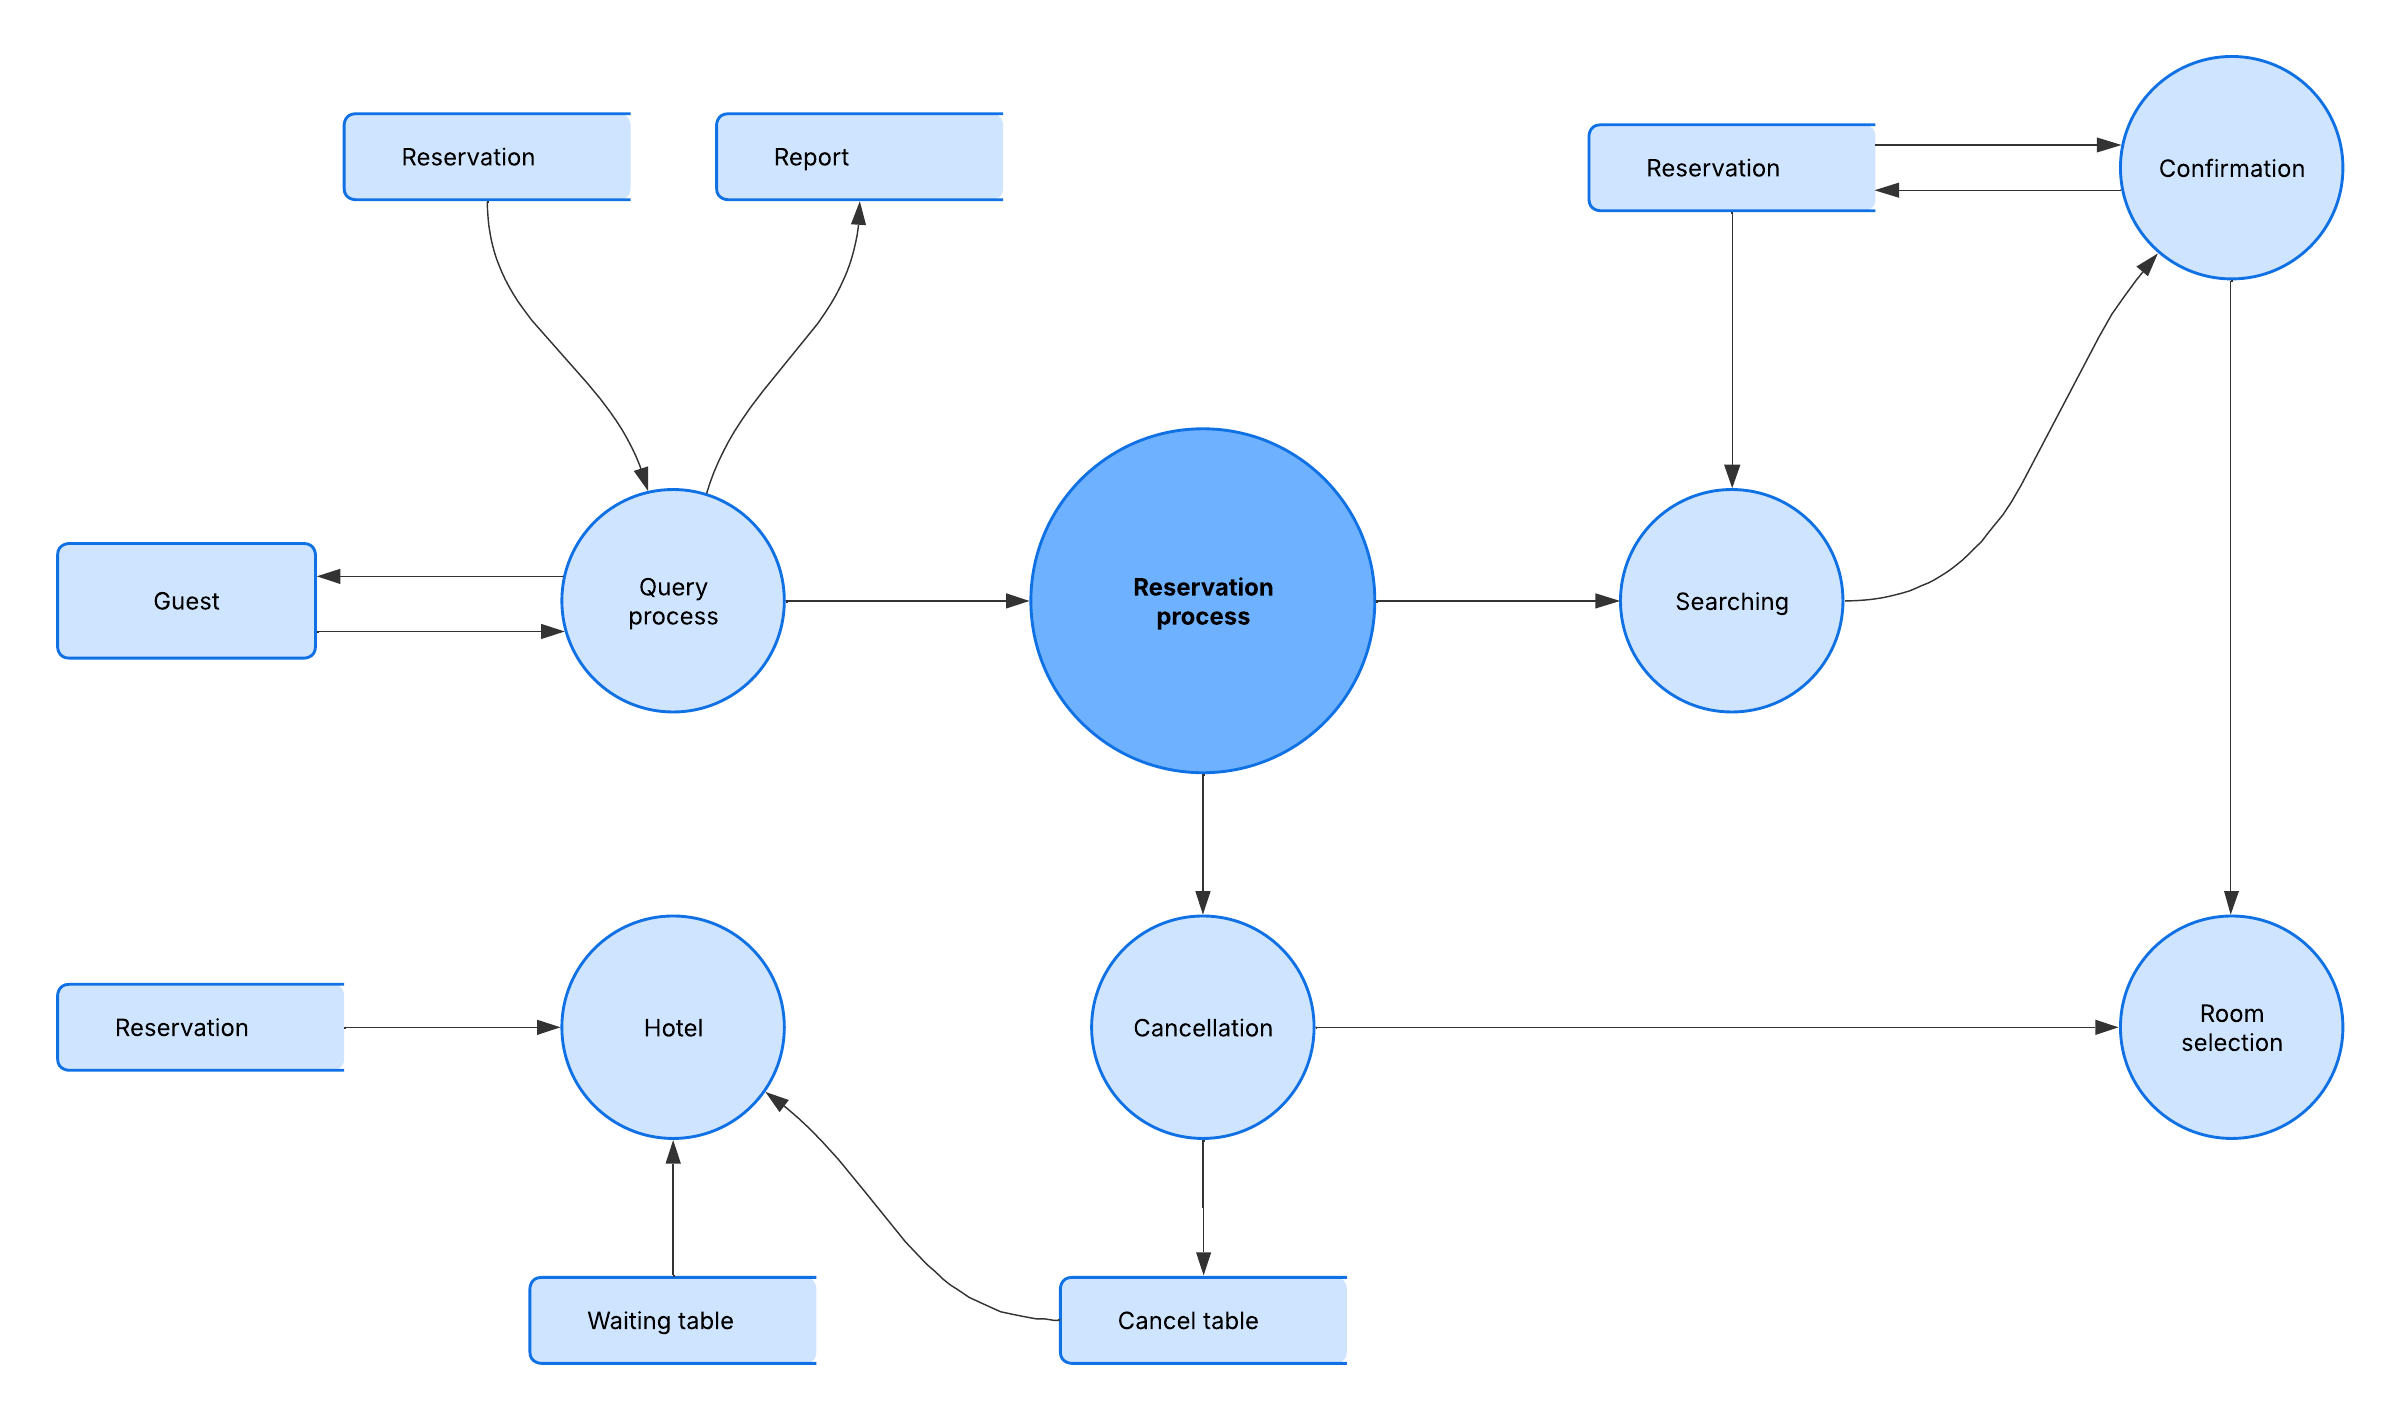
DFD Level 1
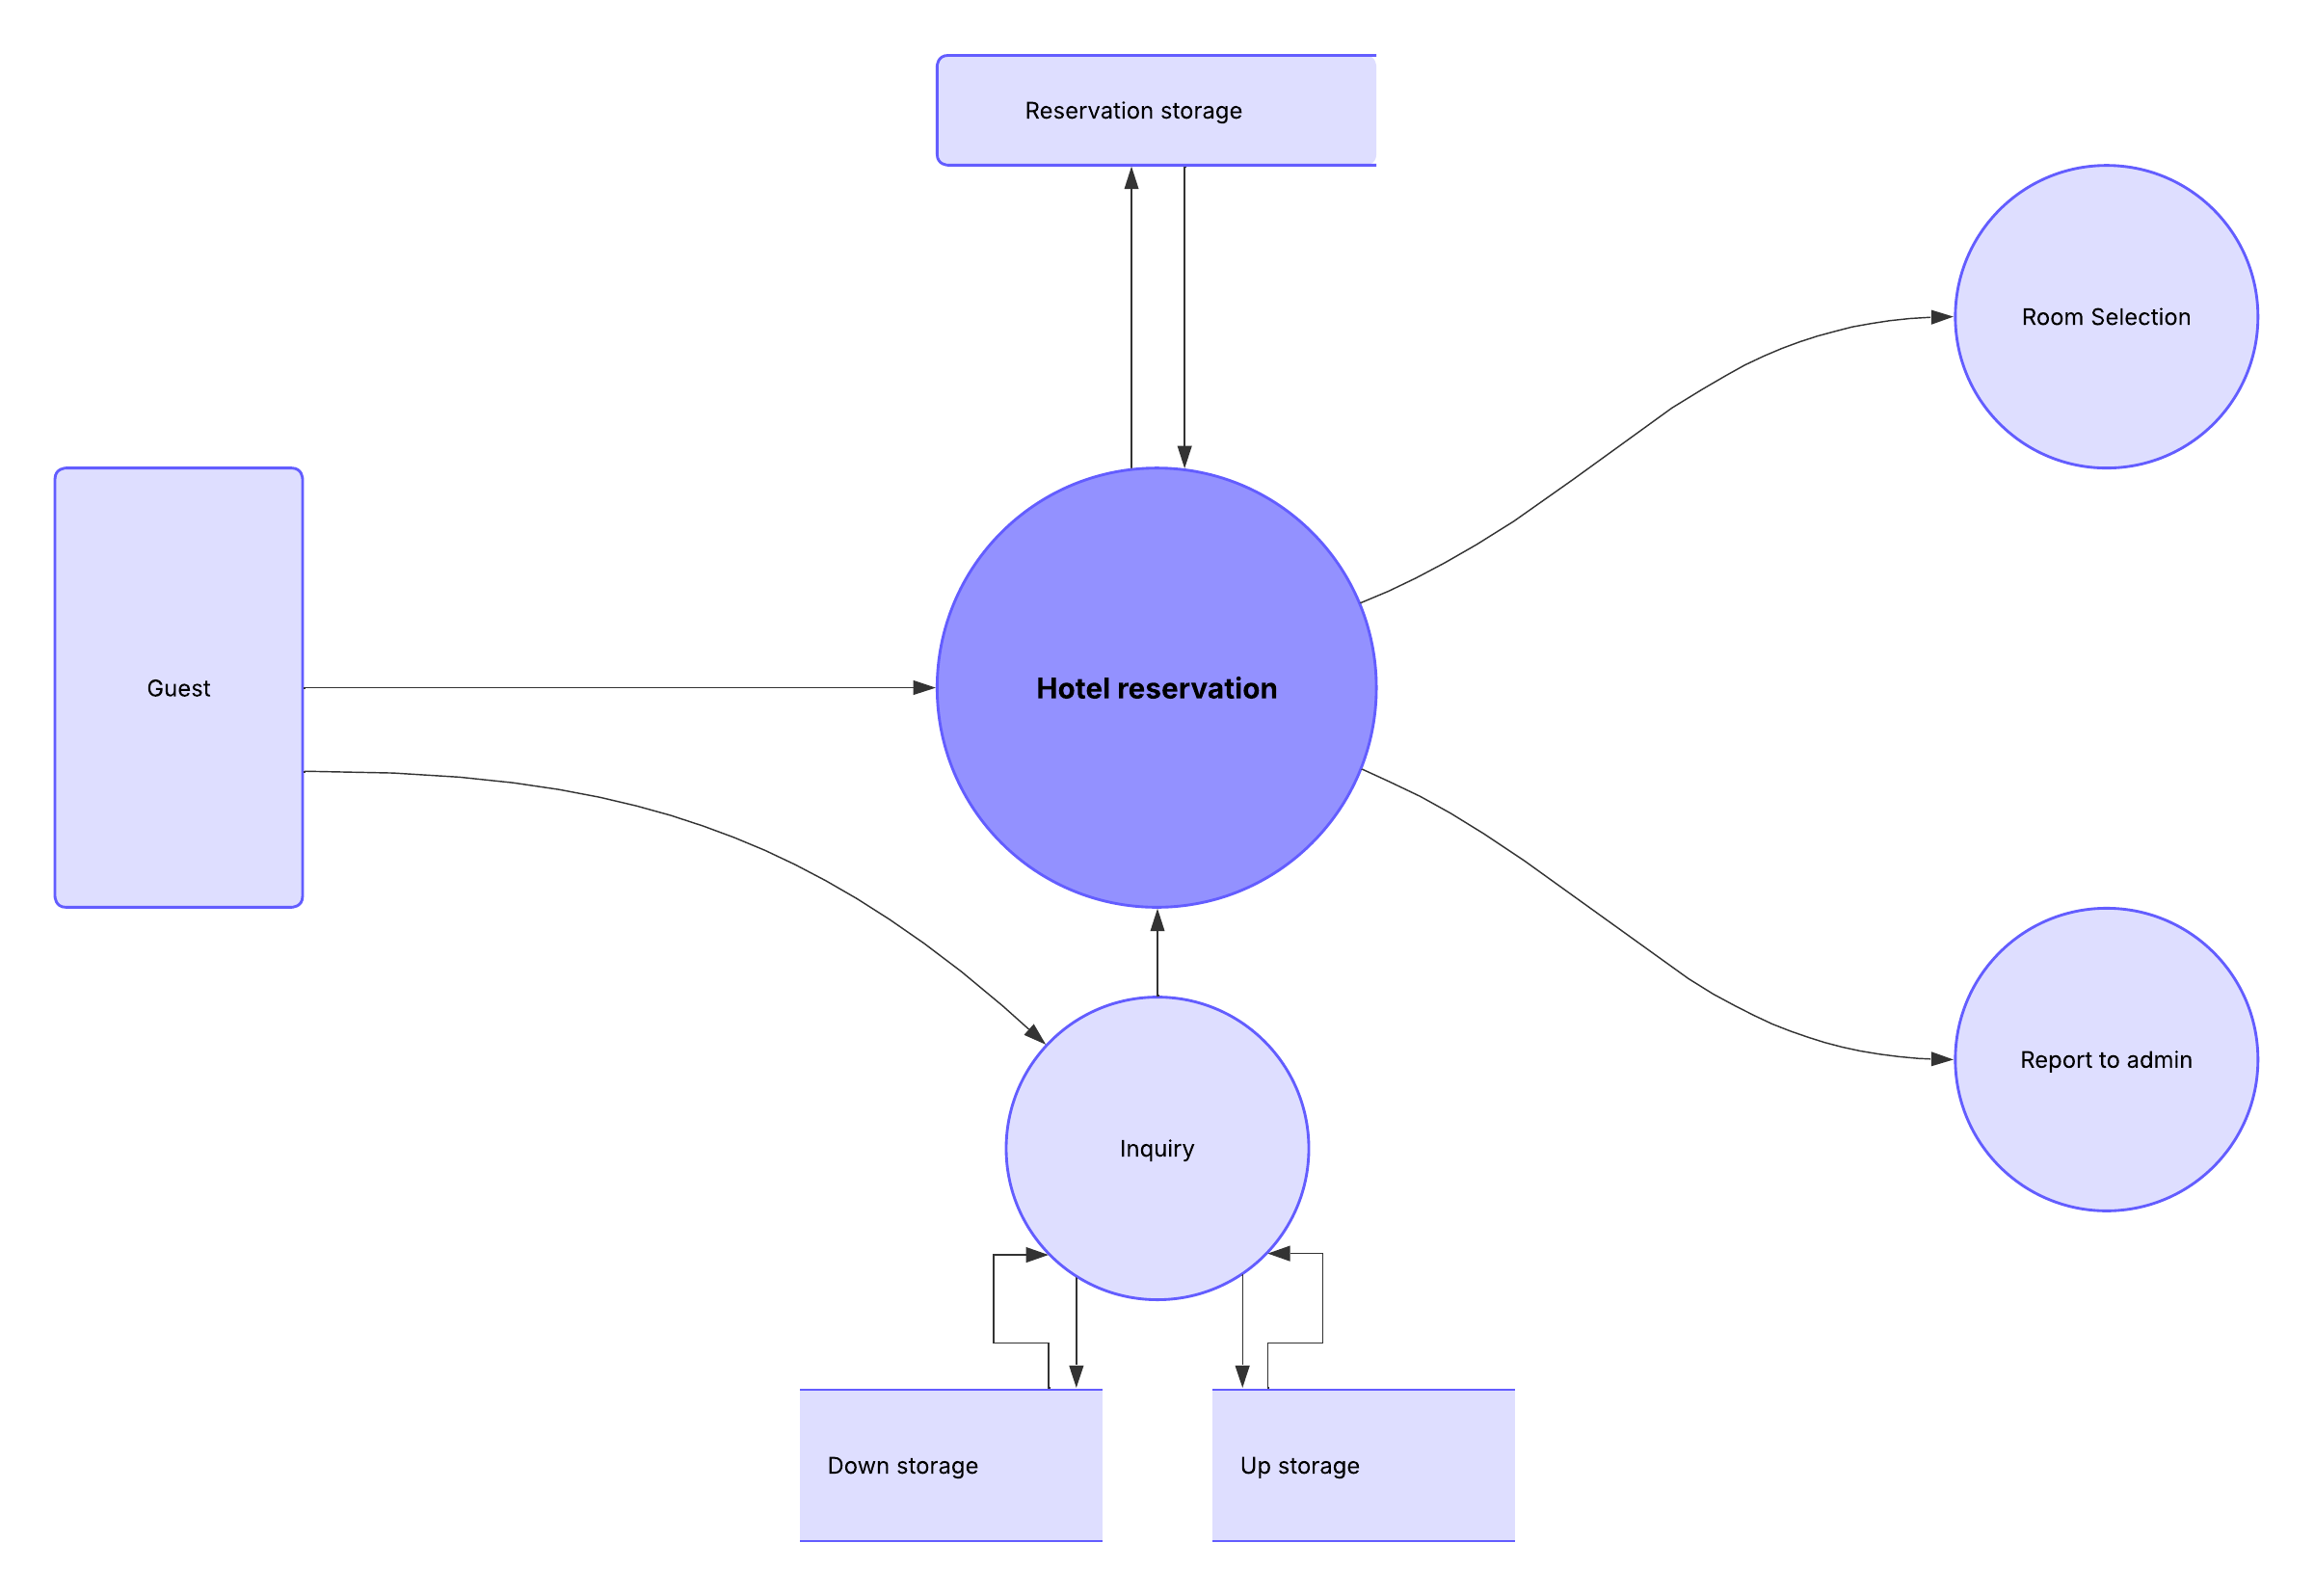
Level 1 breaks the single process into the system's main functions. It shows how those functions exchange data with each other and with external entities.
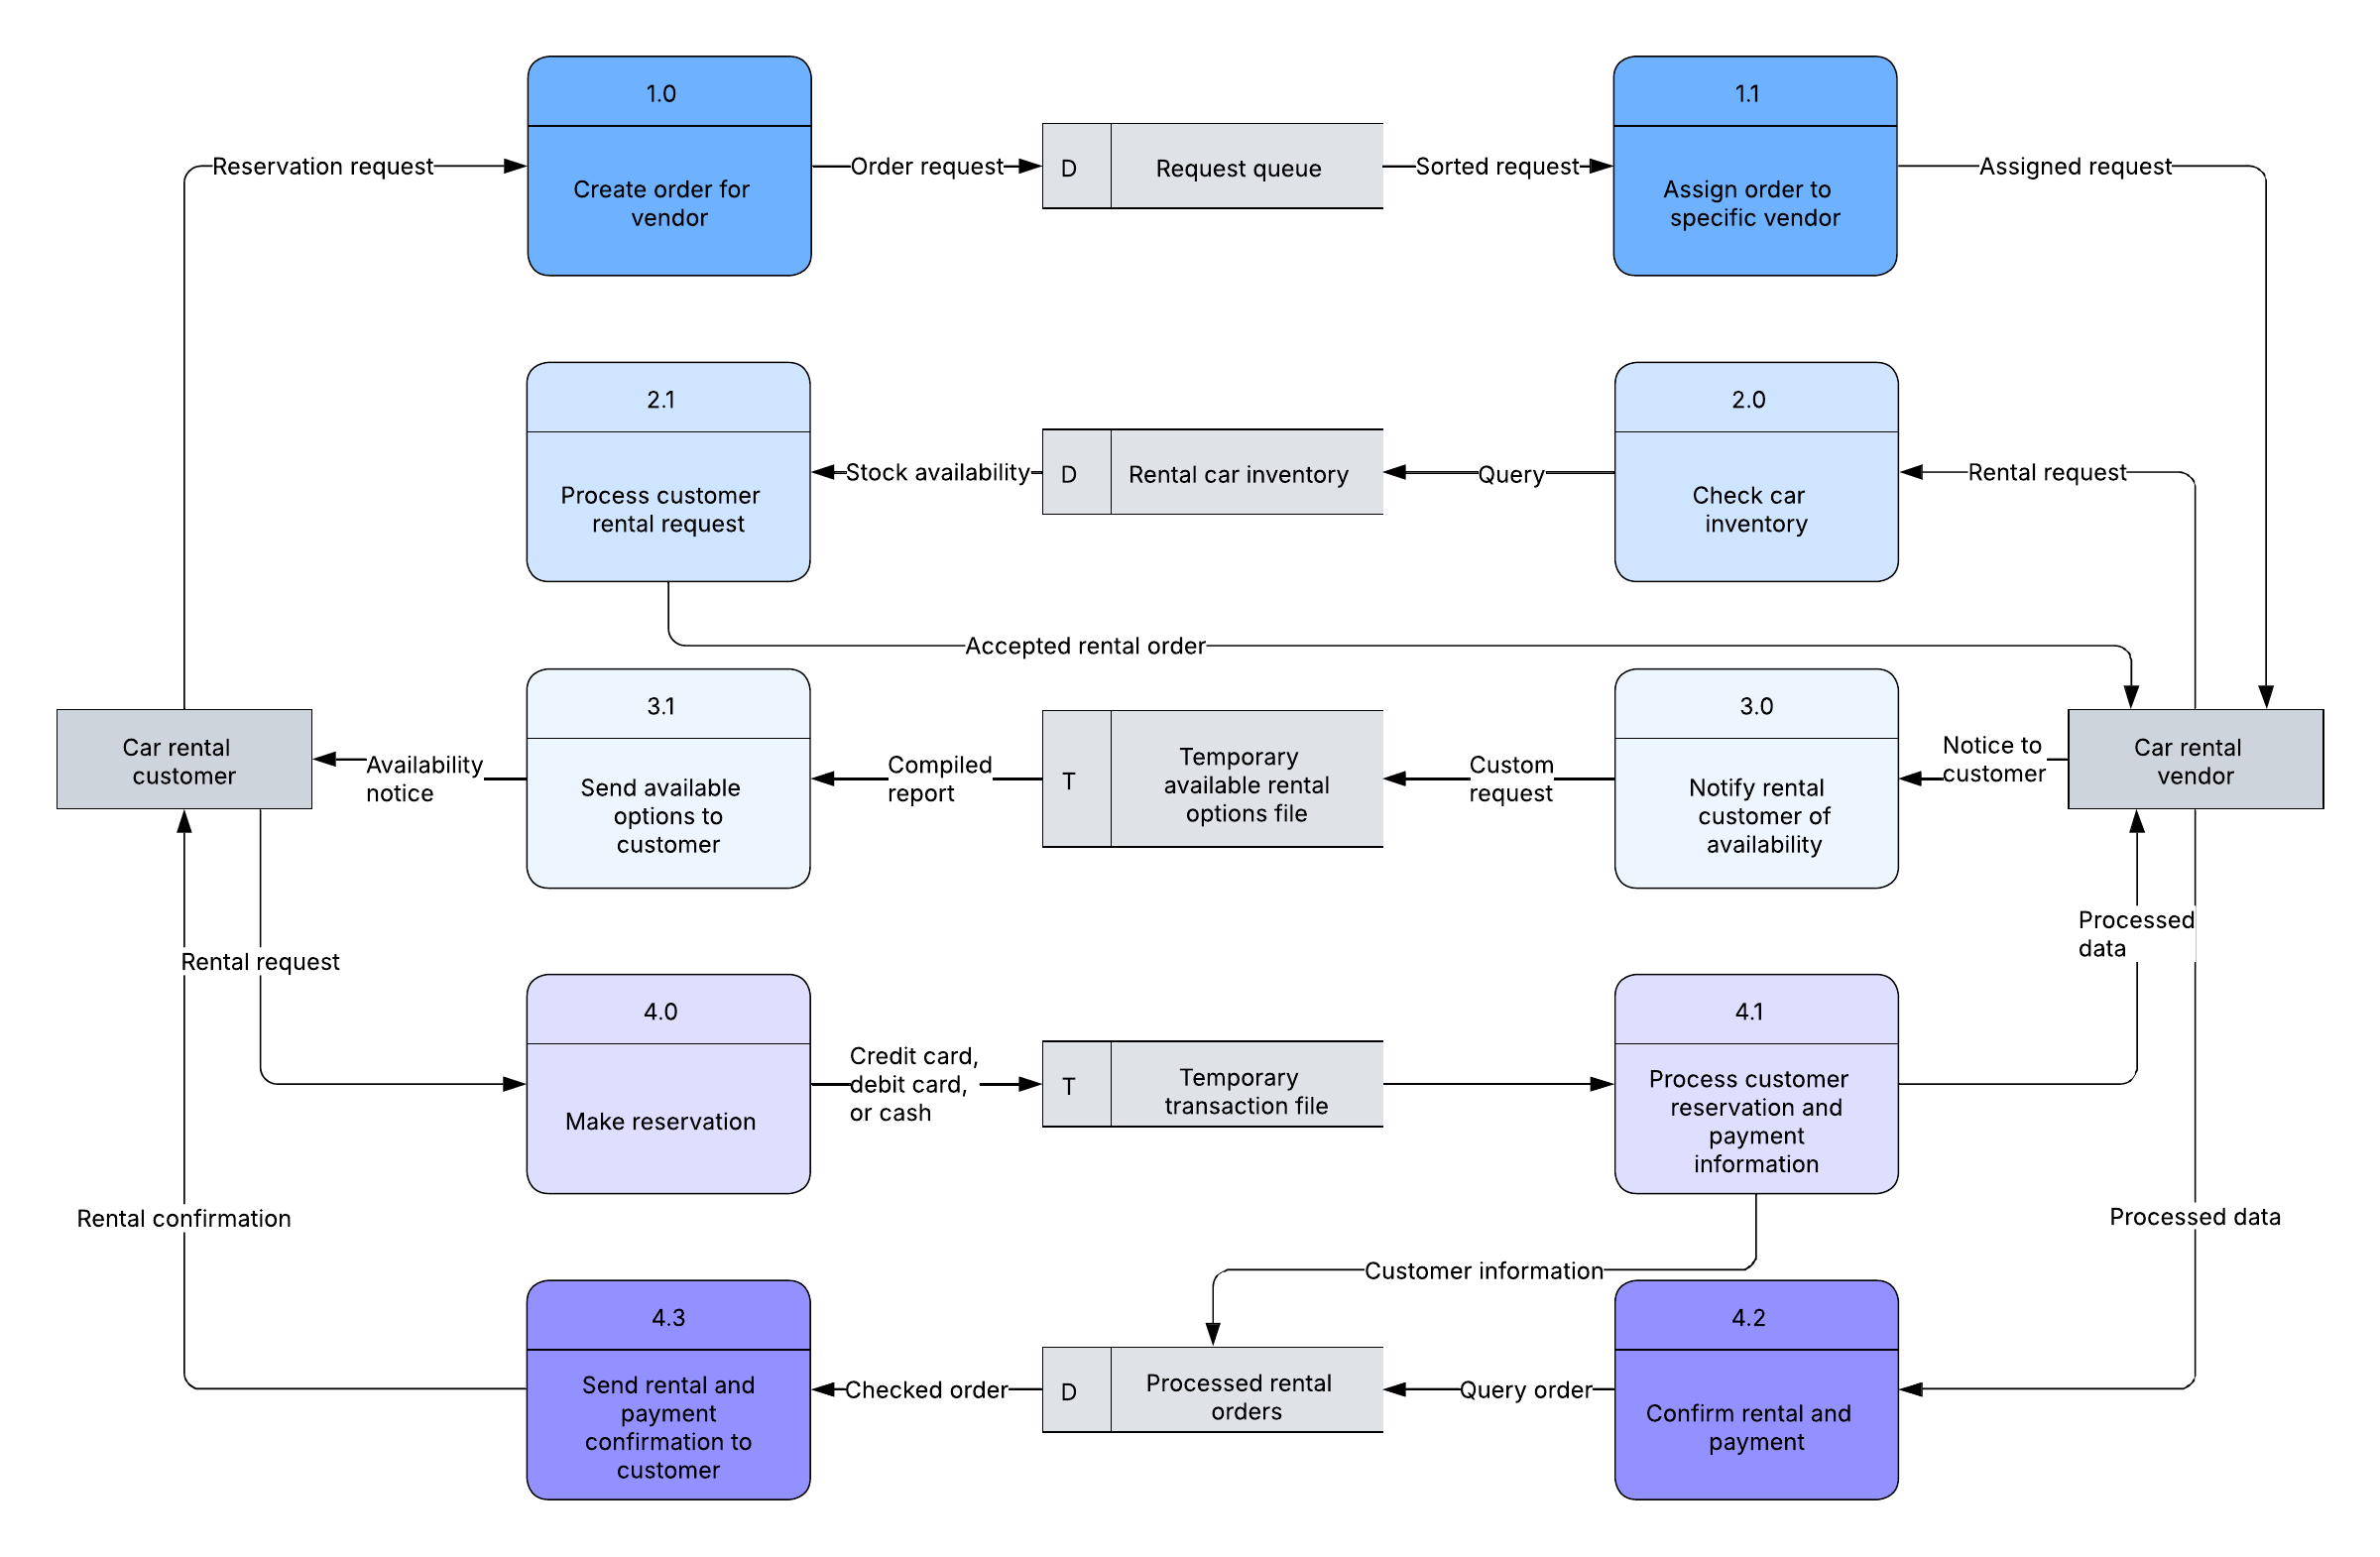
DFD Level 2
Level 2 goes one step deeper into parts of Level 1, detailing the subprocesses inside a function. Progression to Levels 3 and 4 is possible but uncommon, and a sufficiently detailed DFD can help developers write pseudocode.
Common data flow diagram examples and uses
Data flow diagram examples span many roles because the notation suits both technical and non-technical work. A data flow diagram in software engineering, for instance, pairs well with dedicated data flow diagram software.
Software engineering: Model how an application processes, stores, and moves data before writing code.
Business analysis: Document current processes to identify inefficiencies and design an improved future state.
Business process re-engineering: Map existing workflows to redesign them for better performance.
Agile development: Give cross-functional teams a shared, visual reference during planning.
System structure design: Show how components exchange information across a larger architecture.
What is the difference between a DFD and UML?
A DFD illustrates how data flows through a system, while UML is a modeling language used in object-oriented software design for a more detailed structural view. Where a project adopts UML, the activity diagram typically takes over the role that the DFD would otherwise play.
What is the difference between a logical and physical DFD?
A logical DFD shows the essential data flows a business needs to operate, independent of technology. A physical DFD shows how the system is implemented, now or in the future, including files, hardware, and software.
Comparing logical and physical DFDs helps teams separate business requirements from technical implementation. Most projects benefit from building both.
How do you make a data flow diagram?
Start with a template, then add and connect the four core components until the diagram reflects your system. You can create one online in minutes and refine it as your understanding grows.
Choose a starting scope and level, beginning with a Level 0 context diagram.
Add the external entities that send or receive data.
Add the processes that transform that data.
Add the data stores that hold information for later use.
Connect everything with labeled data flows.
Break high-level processes into Level 1 and Level 2 detail as needed.
For a step-by-step walkthrough, see the full guide on how to make a data flow diagram.