Mapping out your network and all the elements it interacts with can be done using quality network diagram software like Lucidchart. Creating a diagram early—especially before setting up a complex environment—helps you see how everything will work together and makes it easier to pinpoint issues later if something breaks.
Here's an in-depth look at network diagrams and network topology, including definitions, tutorials, uses, symbols, and more.
What is a network diagram?
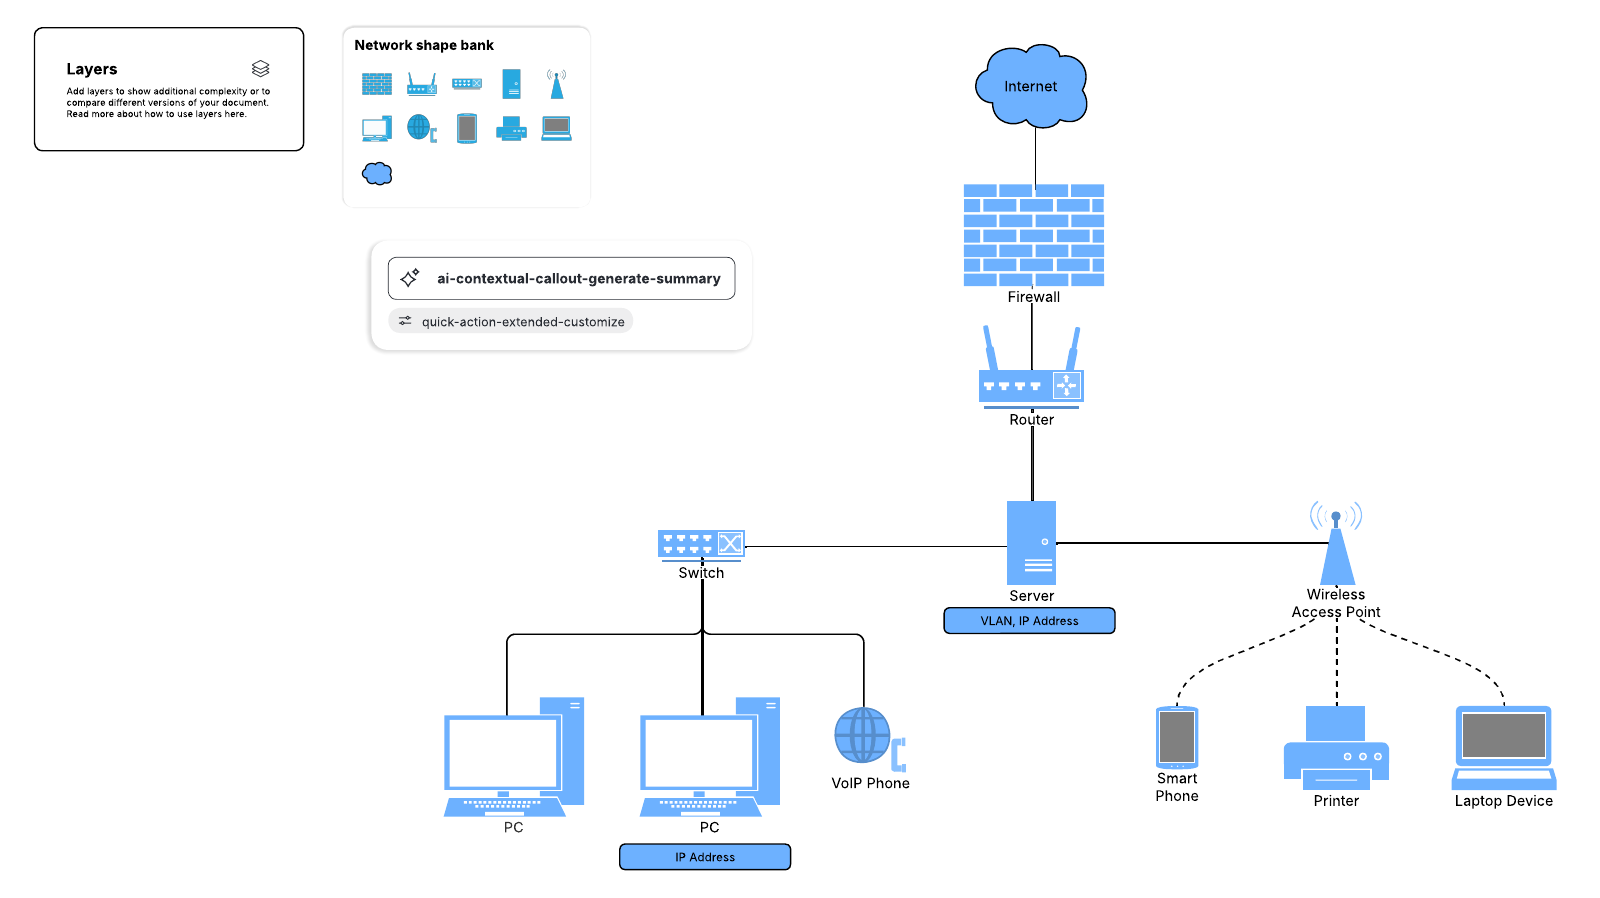
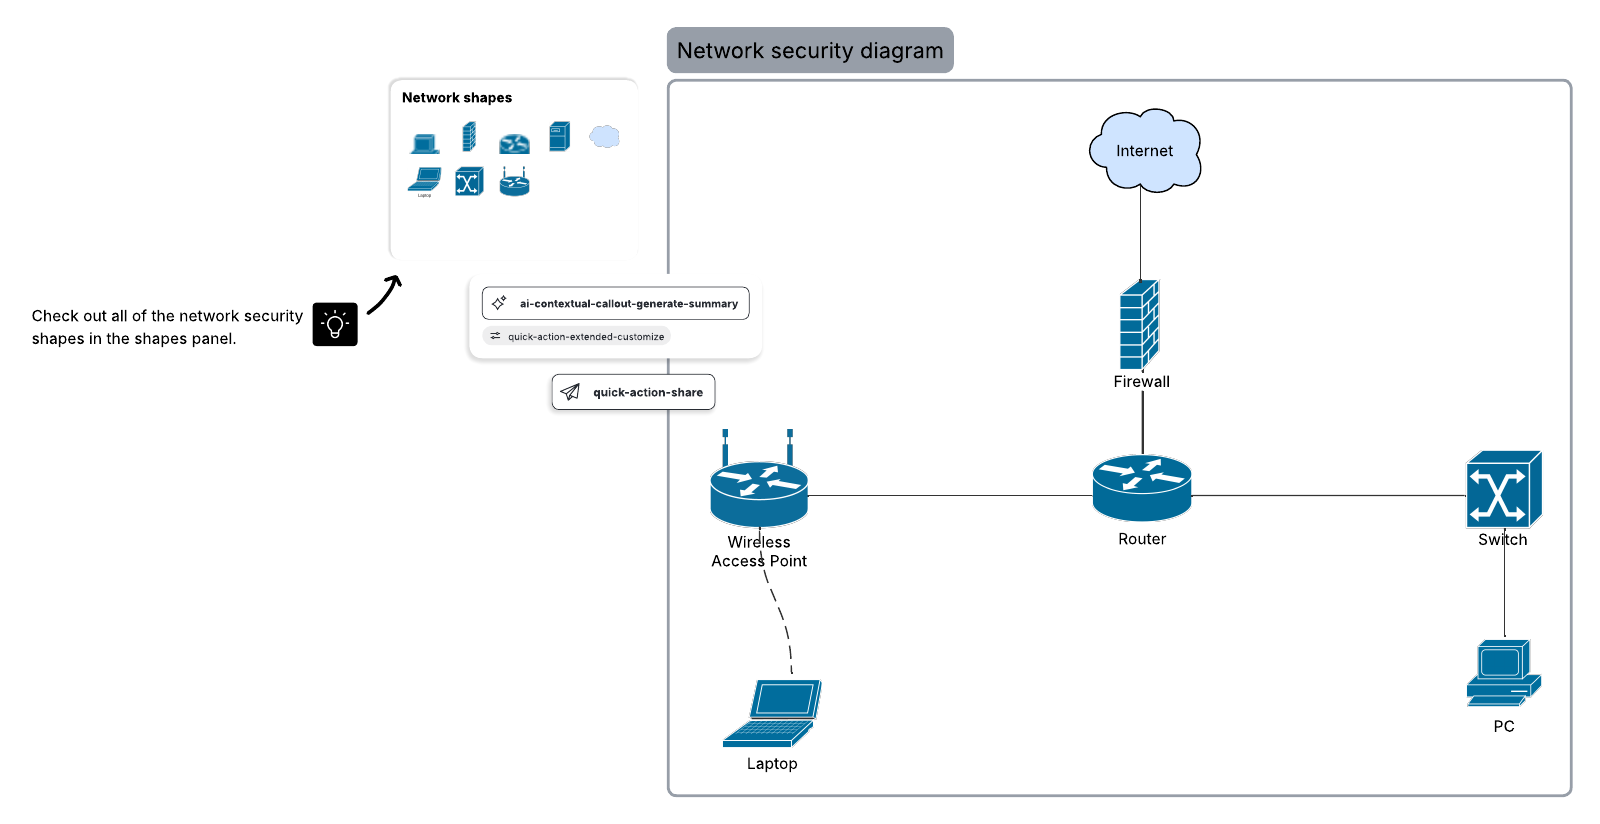
A network diagram is a visual representation of a computer or telecommunications network. It shows the components that make up a network and how they interact, including routers, devices, hubs, firewalls, etc. Depending on the environment, diagrams may also include elements like peripherals, servers, mainframes, and cloud services to show how these elements co-exist within the overall architecture.
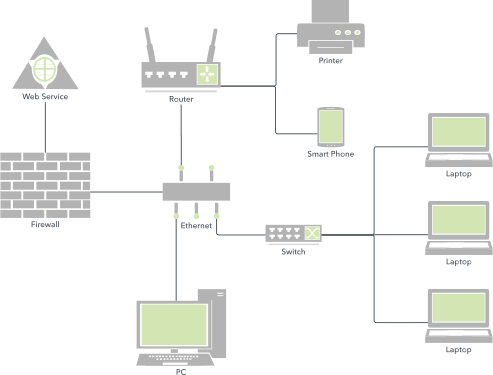
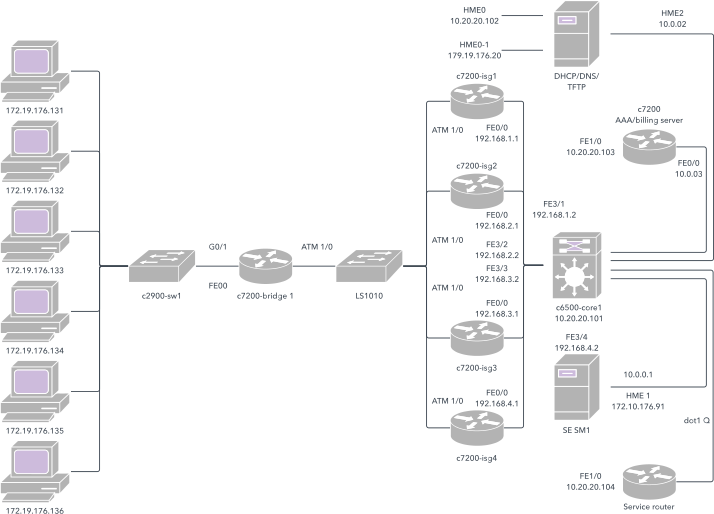
Depending on its scope and purpose, a network diagram may contain lots of detail or just provide a broad overview. For instance, a diagram of a local area network (LAN) might show the IP addresses of individual computers, while the diagram of a metropolitan area network (MAN) could represent buildings or areas with a single node.
A network diagram can be either physical or logical.
Logical network diagrams
A logical network diagram describes the way information flows through a network. They typically show subnets (including VLAN IDs, masks, and addresses), network devices like routers and firewalls, and routing protocols.
Physical network diagrams
While the logical network diagram shows functional design, a physical network diagram shows the actual physical arrangement of the components that make up the network, including cables and hardware. Typically, the diagram gives a bird's-eye view of the network in its physical space, like a floor plan.
An effective physical network diagram could display:
- Wi-Fi access points and their corresponding channels/frequencies
- Wi-Fi coverage mapping to avoid cross-talk between domains
- The location of phones, computers, printers, and other devices
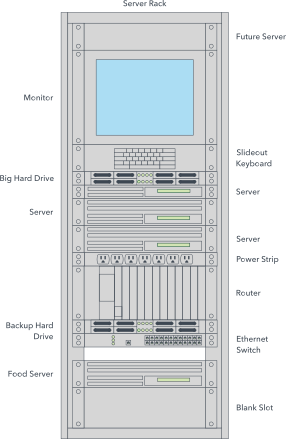
- A layout of the server rack
- Labeled ports to show where computers and other devices connect to the server
How are network diagrams used?
- With their capacity for showing how network components interact, network diagrams can serve a variety of purposes, including:
- Planning the structure of a home or professional network
- Coordinating updates to an existing network
- Reporting and troubleshooting network problems
- Complying with PCI or other requirements
- Documenting for external communication, onboarding, etc.
- Tracking components
- Sending relevant information to a vendor for an RFP (request for proposal) without disclosing confidential information
- Selling a network proposal to financial stakeholders
- Proposing high-level syslog infrastructure changes
Because they provide a clear view of how devices and services connect, network diagrams are also useful both before deployment (to validate how components will work together) and after deployment (to help isolate where failures or misconfigurations might be occurring).
Benefits of a physical network diagram
Physical network diagrams offer specific, unique benefits: When you experience network issues with your office or data center, it’s not always caused by a breakdown somewhere in the recesses of the internet. It may be caused by physical objects that are no longer functioning as they should. Network engineers need a visual representation of this space to understand where the problem may lie.
Aside from offering a simple visual for pinpointing possible issues, network diagrams provide many other benefits for your company. Using network diagrams can help with:
Planning network updates
Anytime you need to make a change, refer back to your network diagram. For example, do you need to add more devices to your network? Figure out where you have port space available, how this device will connect to the Internet, etc.
Keeping track of PCI compliance
If you collect credit card information from customers, make sure you have the proper firewalls and access control measures in place and have followed the requirements for physical security. Learn more about how you can make network diagrams that help you prove and maintain compliance by meeting criteria outlined in PCI compliance standards.
Creating network documentation
Creating network diagrams are an essential piece of documentation that every department should have. Hosting your network documentation in a central location like Lucidchart ensures teams have access the current state of your network as they address network problems during network troubleshooting, as your department responds to audits, during security reviews, and more.
Onboarding
Everyone should be on the same page as far as how the network functions and how all the elements connect. Bring new IT engineers up to speed quickly with thorough documentation in Lucidchart, and in the apps you already frequently use, such as Confluence, Jira, Microsoft, Google, Slack, and more.
Provide remote assistance for other offices
You may not always have IT teams located in every office. When a branch of your business experiences network problems, IT teams can leverage your up-to-date network diagrams to provide remote assistance, quickly resolving the network issue from afar. You can even use a floor plan to map out where all your physical equipment is located so it can be easily found it in the case of an issue, ultimately helping incident response teams understand how the office is set up, without needing to be there, all while following compliance regulations.
What is network topology?
Network topology refers to the arrangement of elements within a network. Essentially, network topology is the design, and network diagrams are the visuals that document that design. Network topologies can describe either the physical or logical aspects of a network. Logical topology is also known as signal topology.
Different topologies are best for certain situations, since they can affect performance, stability, and other outcomes.
Bus topology
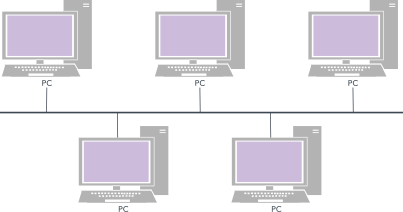
Also known as the backbone, linear, or Ethernet topology, this type of network is distinguished by having all of the nodes connected by a central medium (the "bus"), which has exactly two endpoints.
Bus topologies are easy to configure and require less cable length than some other topologies. However, if the central bus breaks down, so does the whole network, and it can be difficult to isolate the problem.
Ring topology
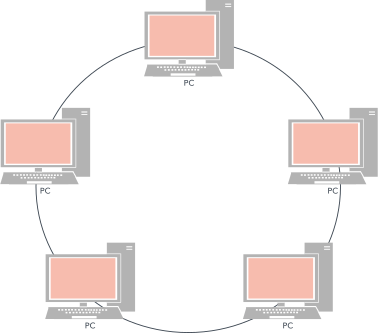
Nodes are connected in a circular pattern, and packets of information are sent through the ring until they reach their destination.
Ring networks can outperform those based on the bus topology, and they can be easily reconfigured to add or remove devices. However, they are still relatively vulnerable, since the whole network fails if a single node fails. Also, bandwidth must be shared across all the devices and connections.
Star topology
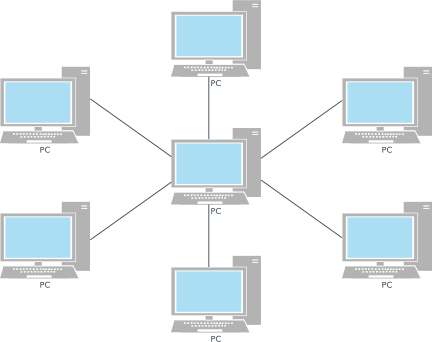
One of the most common topologies, the star topology consists of a central hub or switch through which all of the data passes, along with all of the peripheral nodes connected to that central node.
Star topologies tend to be reliable because individual machines may crash without affecting the rest of the network. But if the central hub or switch fails, none of the connected nodes will be able to access it. Cable costs also tend to be higher for star networks.
Mesh topology
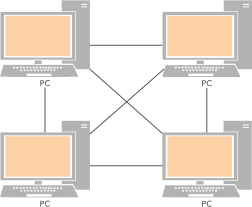
There are two types of mesh topology. In the first, which is called full mesh topology, each node is directly connected to every other node.
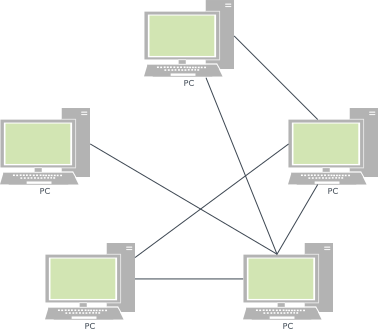
In a partial mesh topology, nodes are only connected to the nodes they interact with most.
Most networks employ some combination of topologies to yield what's called a hybrid topology. For instance, the tree topology combines the bus and mesh topologies.
The logical and physical topology of a particular network may resemble one another, or they may be entirely different. For example, a twisted pair Ethernet network exists as a star topology physically but follows the bus topology logically.
Network diagram examples
Network diagrams can be used to represent virtually any network, which means that there's a lot of variety. Network diagrams vary in two important ways: by the type of network they represent and by network topology, or the arrangement of components.
Here are a few common types of network diagrams:
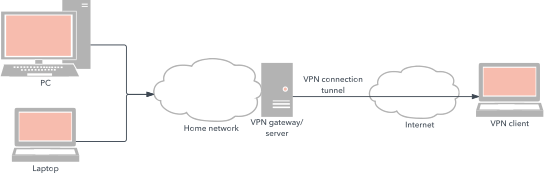
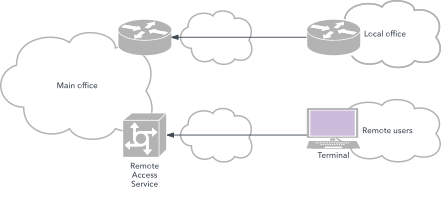
Virtual private network
Allows users to access a private network over a public network as if they were directly connected to that private network
Server rack
Shows the layout of a rack system
Enterprise private network
Connects diverse elements within a business, such as multiple sites
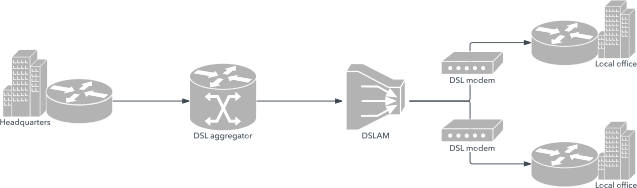
DSL network connectivity
Shows how information is relayed over telephone lines
See the network diagram templates available from Lucid for additional examples.
How to make a network diagram
Before you start making a diagram, make sure you have a clear goal in mind. It's better to create multiple diagrams, each capturing a different aspect of the network, than it is to try to cram all the information onto one diagram.
Once you've selected a network to map, follow these steps to produce a professional, useful network diagram.
- Identify the equipment. At first, don't worry about connections. Instead, just list all the workstations, servers, routers, firewalls, and other components that are part of the network. If you're using network diagramming software, you can accomplish this by simply dragging shapes onto the canvas. If you need help determining which shapes to use, check out our guide to network diagram symbols. For readability and consistency, it helps to stick to a single icon set within a diagram whenever possible, rather than mixing styles.
Pro tip: Many teams find it helpful to sketch the diagram on paper first—starting with a component list (e.g., cloud services, servers, clients, mainframes, peripherals, hubs, routers)—before translating it into a digital diagram. - Group the shapes. To begin arranging your diagram, move related shapes closer to one another. Shapes may be related either logically or physically, depending on what kind of diagram you're drawing. In addition to proximity, you can group related items using containers (boxes) so it's obvious which components belong together.
- Add connections. A line between two shapes shows that they are connected somehow, typically by the flow of information. As you add connectors, try to route lines so they don't cross; this makes connection points easier to follow at a glance. You can also use different colors or arrow styles to distinguish connection types or directions of flow.
- Label. Include any additional information about each shape that you consider useful to your audience. You may choose to place that information next to each component or to number the components, then add additional info in a legend. As you label, consider using different font sizes or styles to visually distinguish endpoint/peripheral labels from backend or core infrastructure labels.
- Final formatting. Adjust the placement, size, color, and other attributes of your diagram elements until you're satisfied. If your diagramming tool supports it, a grid background can make alignment and spacing much easier.
If you're building your diagram in Lucidchart specifically, you can accelerate the process by starting from a template, deleting any unneeded default elements, dragging in the correct icons, and then sharing the finished diagram for review and collaboration.
Using Lucidchart
With Lucidchart, you can create network diagrams faster through intelligent diagramming features. Take a look at the steps below to get started. And if you don’t have a Lucidchart account yet, sign up for free.
- Select a network diagram template
To save time, you can customize one of Lucid’s many premade templates. From the homepage, choose +New > Create from template and then search for network diagrams. If you don’t find a template that fits your needs, you can also start a blank document by clicking +New > Lucidchart > Blank document.
Pro tip: You can also use Lucid AI to generate a network diagram that you can then customize or iterate on. Learn more about this capability. - Name the network diagram
Click on the title in the top-left corner of the screen, and type the name of your diagram in the text box. - Remove existing elements that you don't need on your diagram
A template is just a starting point, but if there are any elements on the network diagram template that you won't be using, remove them now. Right-click on the item, and select Delete. Or simply click the item and then press Backspace. - Add network components to the diagram
Click Shapes on the left side of the editor, and then you can drag and drop shapes from the available shape libraries. If you need additional shapes, click More shapes. Lucidchart offers Cisco Network icons, Oracle Cloud Infrastructure icons, and more. - Name the items in your network diagram
Before you start drawing network connections, name the items added to the diagram. Double-click any shape to highlight and edit its text. You might also want to group entities by adding containers around them. To add containers, select Containers from the left-hand toolbar and then drag and drop the option that best fits your needs. - Draw connections between components
Click on any component and then drag a line out from one of the circles that appears. Continue to draw all the connections on the network diagram. - Share your network diagram
You can easily share your network diagram with others either via email, Slack, or shareable link. Click Share in the top-right corner of the screen, and a pop-up will appear. Choose how you'd like to share your diagram and set the appropriate level of permissions.
Because Lucidchart is web-based, it's also well-suited to sharing diagrams with stakeholders who need access without worrying about file compatibility.
Make a network diagram
Start a free Lucidchart account to build network diagrams and clarify complex environments.
Sign up free