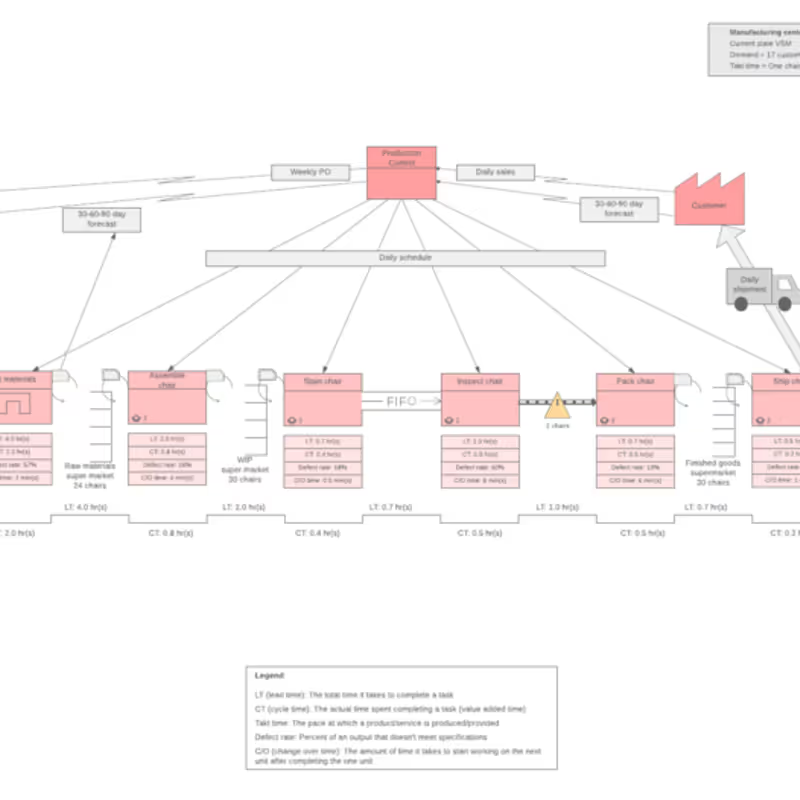
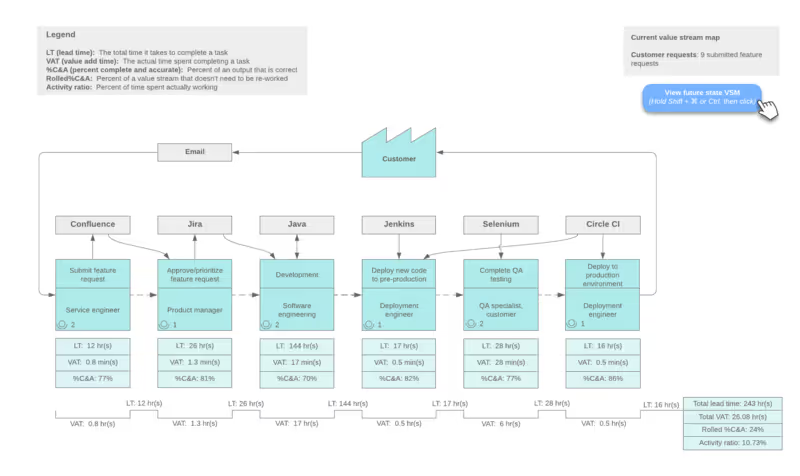
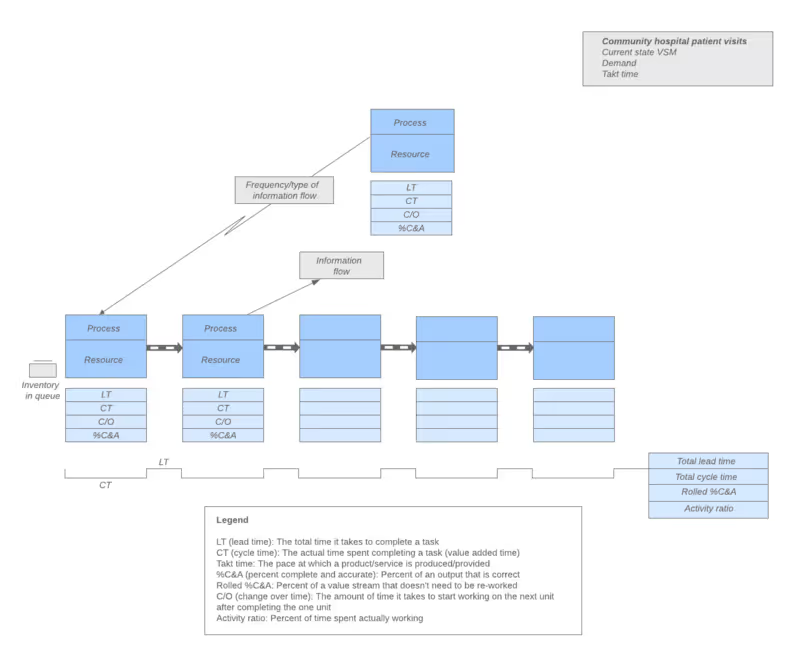
Value stream mapping can be incredibly useful in various industries. If you're a novice to using value stream mapping software like Lucidchart, you'll find that this guide covers all you need to know about the definition, history, and uses of value stream mapping, along with step-by-step instructions for conducting your own value stream analysis.
What is value stream mapping?
Value stream mapping (VSM) is a flowchart method to illustrate, analyze, and improve the steps required to deliver a product or service. A key part of Lean methodology, VSM reviews the flow of process steps and information from origin to delivery to the customer. As with other types of flowcharts, it uses a system of symbols to depict various work activities and information flows.
VSM is especially useful to find and eliminate waste. Items are mapped as adding value or not adding value from the customer's standpoint, with the purpose of rooting out items that don't.
History of value stream mapping
Examples of diagrams showing the flow of materials and information are contained in a 1918 book called Installing Efficiency Methods by Charles E. Knoeppel. Later, this type of diagramming became associated with the Toyota Production System and the Lean manufacturing movement, although it was typically called other terms, such as material and information flow mapping or process mapping. By the 1990s, as Lean production methods were popularized, "value stream map" became a common term.
Value stream mapping also came to be used in Six Sigma methodologies. Lean and Six Sigma both strive to eliminate waste and create the most efficient system possible, but they identify waste differently. While Lean practitioners focus on non-value-added activities, Six Sigma focuses more on process variations resulting in waste. Each is ideal in different situations, leading to the formation of a combined approach called Lean Six Sigma.
VSM purpose and benefits
Value stream mapping is a powerful method to eliminate waste. Here are some of the specific benefits of VSM:
-
Identifies waste origin: VSM can help identify the cause of inefficiencies to solve problems at their core.
-
Focuses on the customer: VSM evaluates process steps from the customer’s standpoint to keep their needs prioritized at all times, ultimately leading to higher value for them.
-
Drives continuous improvement: VSM can act as a roadmap to help companies stay ahead of competition by driving increasingly polished processes at lower costs.
-
Facilitates cross-functional communication: VSM can help stakeholders collaborate more effectively by providing a visual to get everyone on the same page.
VSM considerations
While value stream mapping is core to Lean methods, it’s not ideal for every situation. It can be very resource-intensive, and teams won’t see a proper ROI without strategic application. You’ll need skilled team members with experience carrying out advanced VSM, and a significant amount of time—from days to months. Here are some tips to find success with value stream mapping:
-
Start small: When you begin value stream mapping, consider beginning with low-stakes projects to build experience before you tackle more complex maps with a larger, cross-functional team.
-
Target projects with a high impact: After you get the basics down, reserve extensive VSM for complex cases to avoid waste.
-
Practice with manual maps: Start by hand sketching maps to grasp the basics, like as cycle times and ideal states, before moving to software.
-
Maintain a systemic focus: As you map, look at the end-to-end flow instead of individual steps to ensure improvements actually affect the bottom line.
-
Prioritize ROI: When considering using VSM for a project, always weigh the time and labor required against the potential value of the improvements to ensure the process isn’t wasteful
How VSM is used in different fields
Value stream mapping has evolved beyond manufacturing and can focus on different types of flows for different industries. Here are some examples:
-
Manufacturing: Identifies waste in the production process by analyzing material handling and information flow
-
Supply chain and logistics: Roots out costly waste and delays during each step of production
-
Software development: Identifies inefficiencies from idea to implementation, including feedback loops, long wait times, and the need for rework
-
Service industries: Enhances value by optimizing the specific activities required to fulfill external customer requests
-
Healthcare: Streamlines patient treatment steps to ensure care is timely, cost-efficient, and high-quality
-
Office and administration: Improves operations by eliminating wasteful administrative hurdles
What symbols are used
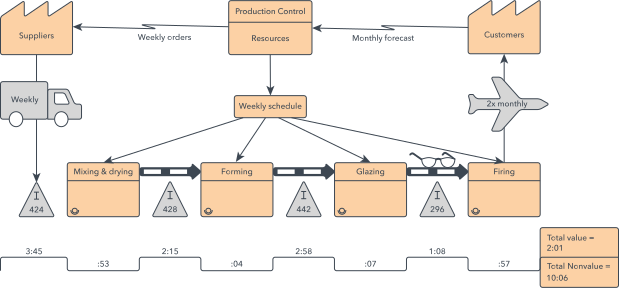
VSM symbols vary in different places, but they fall into these four categories: process, material, information and general. The symbols can be complicated, although some simply imply their meaning in a layman's sense, such as a truck icon for external shipments and eyeglasses for something to go see. Go to this value stream mapping symbols and icons page, opens in a new tab to find out more about VSM symbols.
How to conduct value stream analysis
Phase 1: Preparation
-
Align stakeholders and select the product: Identify the product or service to be improved. Align on goals with leadership. Assemble a team, if necessary.
-
Get leadership buy-in: Ensure management supports the project’s costs and goals. A smaller pilot VSM can help demonstrate potential ROI to stakeholders if needed.
-
Determine the customer’s problem: Use tools like A3 analysis to identify the customers' concerns, such as cost, quality, or delivery speed.
-
Bound the process: Determine the scope of your map, such as raw materials to delivery or a specific problematic department.
Phase 2: Observation
-
Perform the walk: Directly observe the process steps and information flow required to deliver the product or service by walking through it multiple times.
-
Define the process steps: Document significant steps and record what you observe.
-
Collect process data: Fill data boxes for each step with metrics such as cycle time, shifts worked, available working hours, yield, and batch size.
-
Evaluate the process steps: Assess process steps against five key criteria:
-
Value: Does it meet a customer need?
-
Capability: Does it produce high-quality results every time?
-
Availability: Is the process ready when needed?
-
Adequacy: Is there enough capacity to meet customer demand?
-
Flexibility: Can it switch between products quickly?
Phase 3: Mapping and analysis
-
Map flow and inventory: Visualize how products and information move. Look for the following:
-
Flow vs. stagnation
-
Push vs. pull
-
Level vs. erratic
-
Inventory counts
-
Create a timeline: Draw a timeline on the map. Separate value-added time (bottom) and non-value-added time (top) to make waste visually obvious.
-
Identify waste: Reflect on the map to find root causes of waste, such as excess inventory, downtime, long lead times, or rework.
Phase 4: Future state and implementation
-
Design the future state: Sketch out an ideal state VSM that addresses the waste found in your current map. Use Kaizen burst symbols on your current state VSM to highlight the improvements being made.
-
Execute and monitor: Create an implementation plan. Monitor key metrics, and implement further adjustments as necessary by maintaining the document so stakeholders always have access to updated information.
Key tips for effective value stream mapping
-
Experience the flow directly: Walk the whole value stream yourself rather than relying on assumptions. Use a stopwatch to gather real-time data and ensure at least one team member observes the process to maintain a holistic perspective. Then, walk through again to capture more specific metrics and detailed data.
-
Try mapping in reverse: Some prefer to start at the end product and work backward to the origin. This often makes inefficiencies more apparent.
-
Use the “Five Whys”: Constantly question why steps are performed the way that they are. This practice helps you get past surface-level explanations to uncover root causes.
If you build your VSM in a collaborative diagramming application, you can also operationalize it by sharing it with stakeholders and embedding it where work happens (for example, in documentation or team workspaces) so it stays visible and easier to maintain over time. Get started on your value stream map today with a free Lucidchart account.
Want to make a value stream map of your own? Try Lucidchart. It's quick, easy, and completely free.
Make a value stream map