
[Guide] Cloud cost optimization strategies to increase visibility and alignment
Reading time: about 10 min
If you’re feeling the pressure to optimize your cloud spend, you’re not alone: 84% of IT professionals cite cloud cost optimization as their main initiative for the coming year.
Businesses are constantly looking for ways to save money, but according to executives at leading cloud providers AWS, Microsoft, and Google, the recent focus on cloud optimization isn’t coming from a desire to purely cut costs. Instead, organizations are looking for ways to reallocate their cloud spending to other areas, like artificial intelligence, to improve the business’s competitive position.
There are many ways to optimize costs within the cloud, but identifying (and implementing) the most impactful opportunities requires a level of visibility and coordination that many organizations struggle to achieve.
This guide will walk you through the necessary—but often overlooked—cloud optimization strategies to gain complete cloud visibility, reach alignment, and ultimately, reduce cloud costs.
What is cloud cost optimization?
Cloud cost optimization is the process of balancing performance, security, and organizational needs with cost requirements in order to allocate cloud resources most efficiently.
Cloud optimization projects are either reactive, triggered by a noticeable increase in cost or traffic that needs to be addressed, or proactive, triggered by an external condition—like economic or competitive pressure—that prompts an organization to investigate areas to cut costs.
Many organizations are prioritizing proactive measures now, but getting started isn't easy without a clear trigger to guide the efforts. In fact, 2023 marked the first time that managing cloud spend has overtaken security as the top cloud challenge facing all organizations.
Managing spend is the top challenge due to multiple obstacles that companies face, from struggling to visualize existing cloud resources to being misaligned on strategic decision-making. We’ve broken down the top cloud cost optimization challenges that organizations encounter as they manage their cloud architecture.
Three significant cloud cost optimization challenges
Challenge #1: Limited visibility into the cloud environment
Many organizations rely on their native cloud provider console (from AWS, Azure, or Google Cloud) for cloud optimization projects, potentially alongside various cloud management and FinOps tools.
While these tools are valuable for cost reporting and monitoring, they don’t provide the context needed to make educated decisions about which resources you can downsize, turn off, or move to different storage. You’ll have a hard time spotting inefficiencies or waste if your main optimization strategy is sifting through text-heavy lists of cloud resources.
While some cloud management tools offer basic visualizations, these are often static and don’t allow you to customize views or dig into the data. In other words, they won’t give you all the context you need to clearly identify optimization opportunities.
Simply put: If you’re trying to optimize the cloud without full visibility into your environment, you’ll have a labor-intensive, time-consuming project ahead of you—and you may even miss some key ways to accomplish cloud cost reduction.

Talk with other IT professionals
Join Lucid's Community to get inspired about cloud cost optimization, share ideas, and ask questions with other professionals in your field.
Join nowChallenge #2: Difficulty collaborating and aligning
Different teams across the business often purchase or deploy cloud instances independently from one another without communication and coordination. When it’s time to optimize, you’ll have to work together across teams to bridge your various areas of knowledge and expertise.
However, reaching a shared understanding across teams is often tricky, especially when you have to jump between tools to problem-solve, ideate, and design solutions. In our own research, 47% of knowledge workers reported that some projects fail to meet their objectives due to alignment issues.
The main culprit of misalignment? Poor documentation and information sharing. Without a simple and standardized way to share ideas, information, or updates, cloud optimization projects will be plagued with misalignment.
Challenge #3: Not enough time or resources
Cloud optimization is important, but so is deploying new software, managing IT tickets, and all your other day-to-day tasks.
When you lack the proper visibility and alignment, cloud optimization can take a significant amount of time to do at all, let alone do it right.
Imagine this scenario: You’re ready to start optimizing the cloud, so you jump into your cloud console, searching for unused resources or traffic anomalies. Without a visual, your best course of action is to manually dig through tables and lists. When you think you’ve spotted a potential area to investigate further, you pull up a spreadsheet to note your idea.
As you dig deeper, you realize you have questions about which resources are being used for what, so you reach out to your engineering teammates via Slack. It’s difficult to explain your question, so you have to hop on a call to talk through it. You continue to go back and forth with different teams as you progress—digging through the console, taking notes in your spreadsheet, searching through Slack threads, jumping on call after call, and so on.
It’s easy to see how this process is inefficient, tedious, and slow. It’s time for a new approach.
The solution: 6 cloud cost optimization strategies and steps
Organizations that wish to optimize their cloud budget effectively and give themselves a competitive edge need an approach that addresses all of the above challenges.
Here’s how to maximize visibility, facilitate collaboration, and simplify the cloud optimization process. Together, these cloud cost optimization strategies form actionable steps that you can take to ultimately reduce your cloud cost.
Step #1: Visualize your current state
Before you can start to find areas to optimize your cloud, you need to understand your full environment, including what resources you have, how they’re used, and how they connect to other resources.
Capturing the full context of your cloud environment is significantly easier with a visual representation versus a report or dashboard.
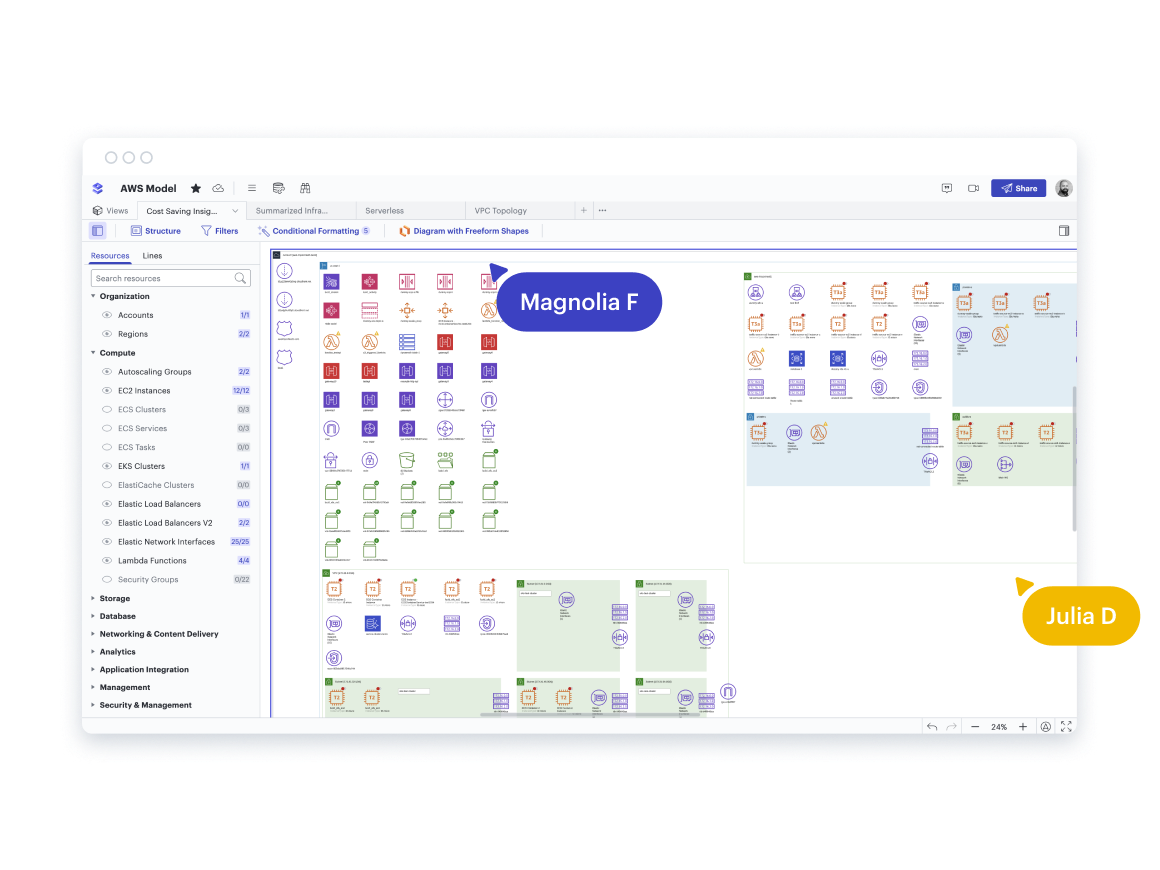
We recommend using a cloud visualization solution, like Lucid’s Cloud Accelerator, that automatically generates an interactive diagram of your cloud environment for you. Unlike the static visuals that some tools provide, Lucid's diagrams allow you to customize views and interact with your data so you can confidently understand your current cloud infrastructure.

Case study: How Informatica gained visibility into their cloud
See how one large software company used Lucid to understand and document its cloud infrastructure.
Check it outStep #2: Look for waste, overlap, and other cost-saving opportunities
With your cloud visualization, you can investigate your current resource usage, storage, and traffic for areas to optimize. Keep an eye out for these cost-cutting opportunities:
- Areas to scale down: Look for storage resources that are larger than necessary. You can also look for storage that falls above a certain threshold to identify where you’re potentially overspending. Either way, right-sizing resources is a great way to proactively cut costs.
- Unused resources: It’s not uncommon to wind up with unattached or extra storage resources after either removing compute instances or stopping them. Deleting or stopping a compute instance does not also delete or stop the associated storage resource, so be on the lookout for storage you may be paying for but don’t need.
- Storage type: Sometimes, it’s not a matter of deleting storage or volume but instead transitioning it to a less expensive type. Identify which data is in hot storage (data you need fast and frequent access to) and which is in cold storage (data you rarely need). Cold storage is significantly cheaper, so you can identify quick cost-saving opportunities by transitioning unnecessary hot storage to cold storage.
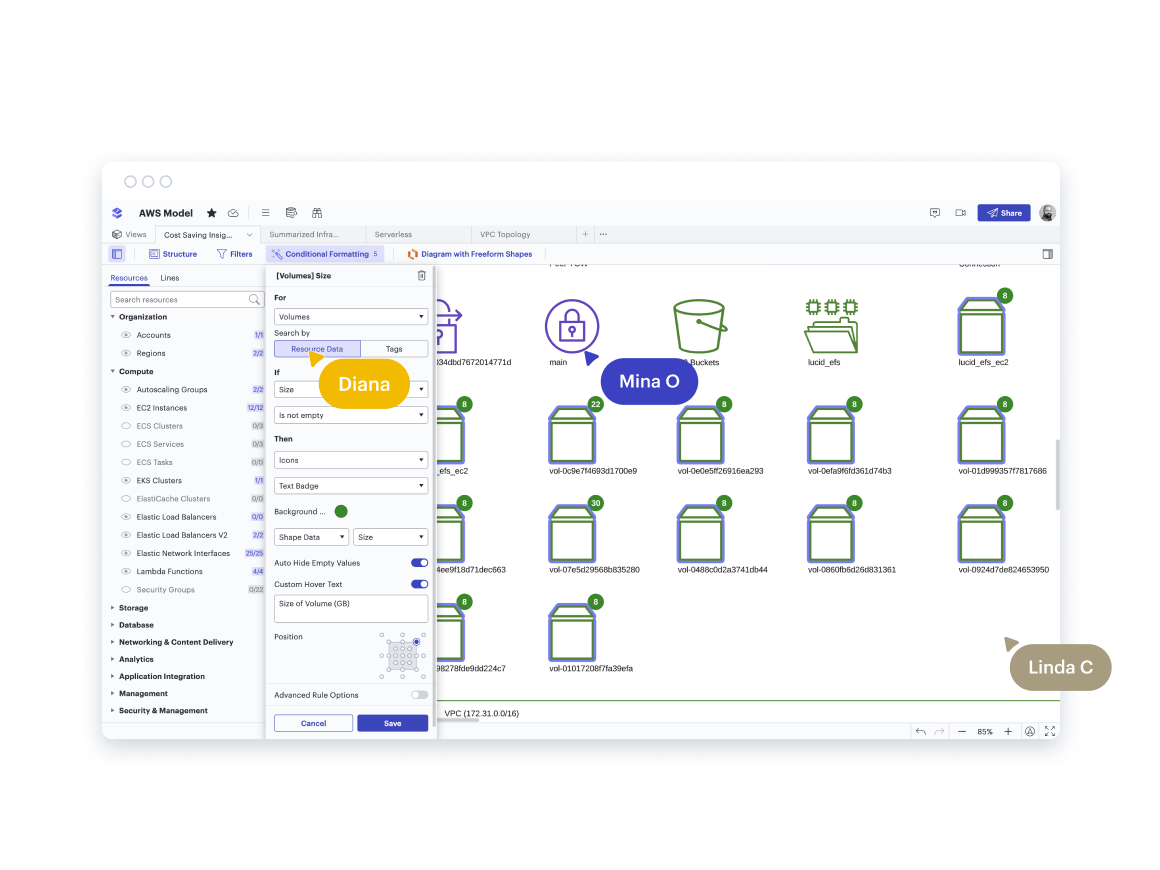
Using your cloud provider console for this step is possible, but that process is prolonged and manual, increasing the likelihood of missing key optimization opportunities. With a cloud visualization solution, however, you can find far more opportunities in less time simply by adding filters and conditional formatting rules to your cloud diagram.
With Lucid's Cloud Accelerator, you can leverage out-of-the-box rules to spot traffic, storage or volume size, storage or volume type, orphaned resources, and stopped resources. You can also set up your own rules unique to your specific use cases.
Step #3: Brainstorm and align on cost optimization improvements
Rarely do cloud optimization projects happen in a silo. You’ll likely need to loop in other teams to get input, ask questions, brainstorm and prioritize ideas, and address any potential concerns.
This step is one of the most essential parts of the process but also one of the most difficult without the right collaboration solutions. Think back to the example scenario we shared earlier: If you use a mix of email, instant messaging tools, spreadsheets, and Word docs to work together, it will take you a very long time to reach alignment.
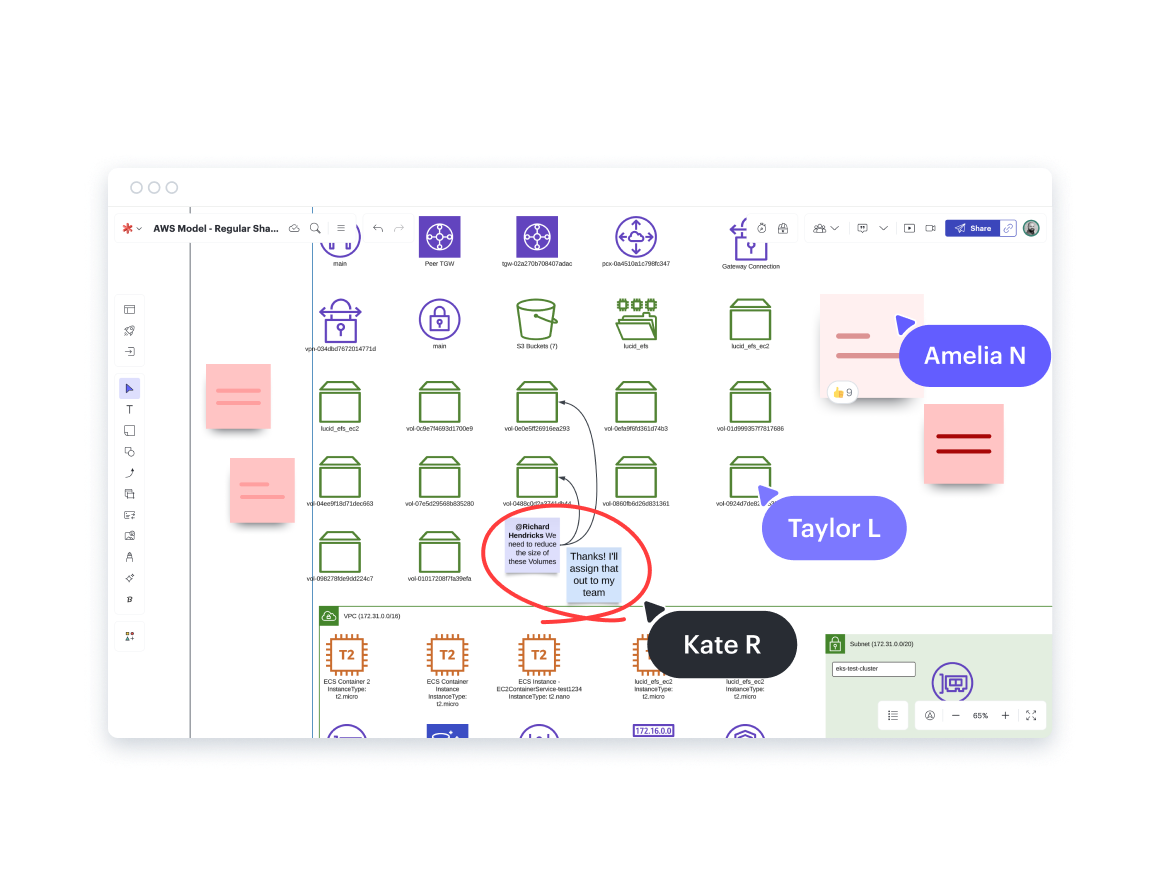
That’s why we recommend using a visual collaboration solution to capture ideas, comments, notes, and questions in one central location—along with your cloud diagram. With Lucid, you can take advantage of collaborative features like comments, freehand drawing, sticky notes, and facilitation tools. Add ideas and questions right to the cloud diagram itself without the need for a separate collaboration tool.
Whether you’re collaborating live or asynchronously, you can reach alignment quickly with all communication occurring in one single source of truth.
Step #4: Diagram your future state (if needed)
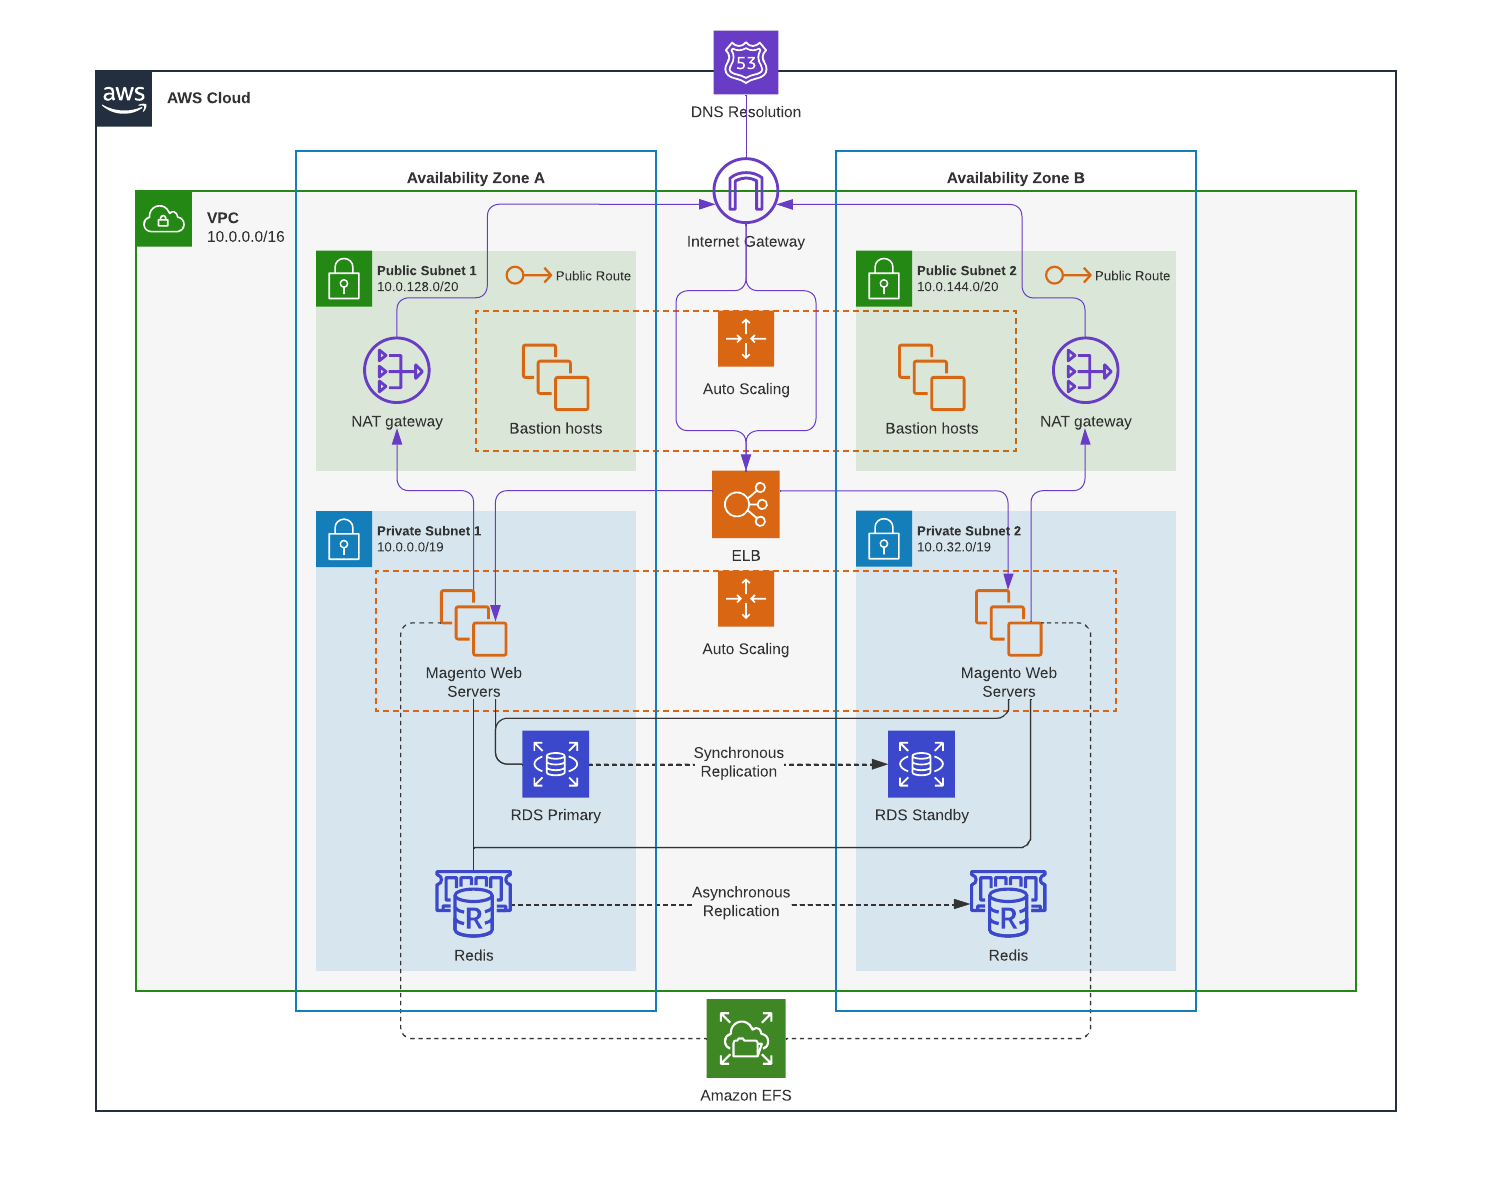
Depending on the size and impact of the changes you’re proposing, you may want to diagram what the future state of your cloud infrastructure would look like. A future state diagram can give you a clear picture of what changes need to happen and serve as a plan to validate deployment after you implement changes.
If you’re using Lucid, you can jump into Lucidchart—taking advantage of shape libraries and templates for the major cloud providers—to diagram your future state. Switch between Lucidspark’s virtual whiteboarding toolset and Lucidchart’s intelligent diagramming toolset as needed using Lucid’s universal canvas.
Step #5: Make and implement a cloud optimization plan
Once you’re aligned on what changes are needed to manage cloud costs, you’ll want to plan out who is responsible for implementing those changes and by when.
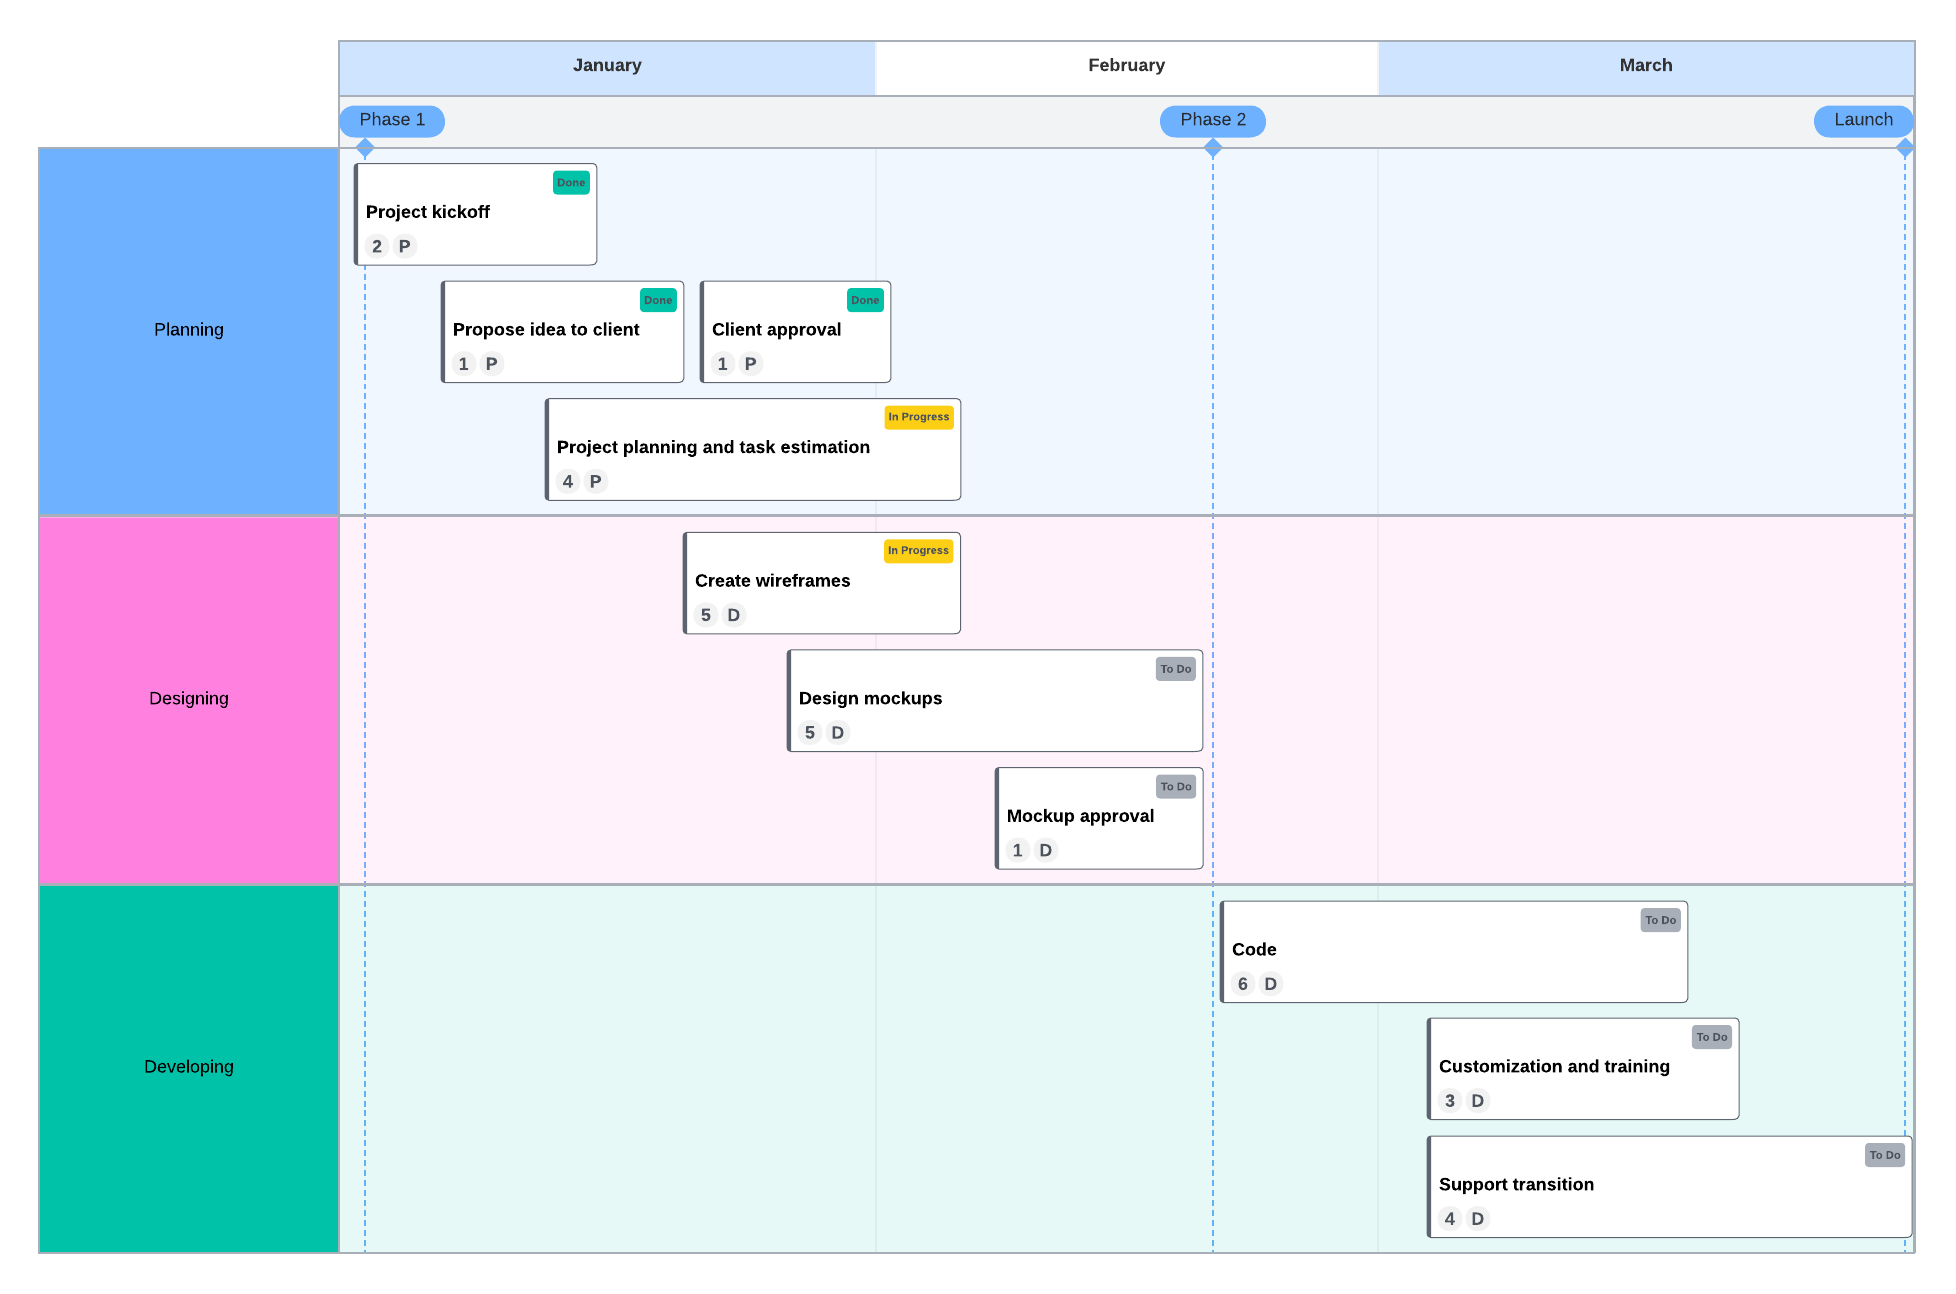
Creating a clear project plan increases accountability, allows you to track optimizations made and their impact, and serves as an artifact to share with stakeholders for buy-in. You’ll want to include your goals, priorities, and timelines in your project plan.
Using Lucid, you can create visual timelines that sync to task management systems you’re already using, like Azure DevOps or Jira. With a two-way sync, your Lucid project plan will stay up to date as teams work on completing the optimization tasks. Not only does this save you time when planning sprints or assigning out tasks, but it also makes it easy for engineers and IT teams to see how their work ties into the larger optimization goals. Plus, when you share your Lucid cloud optimization plan with those involved, they can raise concerns, ask questions, and contribute ideas, all leading to a greater sense of shared responsibility.
Step #6: Validate deployment after optimizations are made
After you and your team have implemented the planned cloud optimizations, you’ll want to get an updated view of your cloud architecture to ensure the plan was carried out properly.
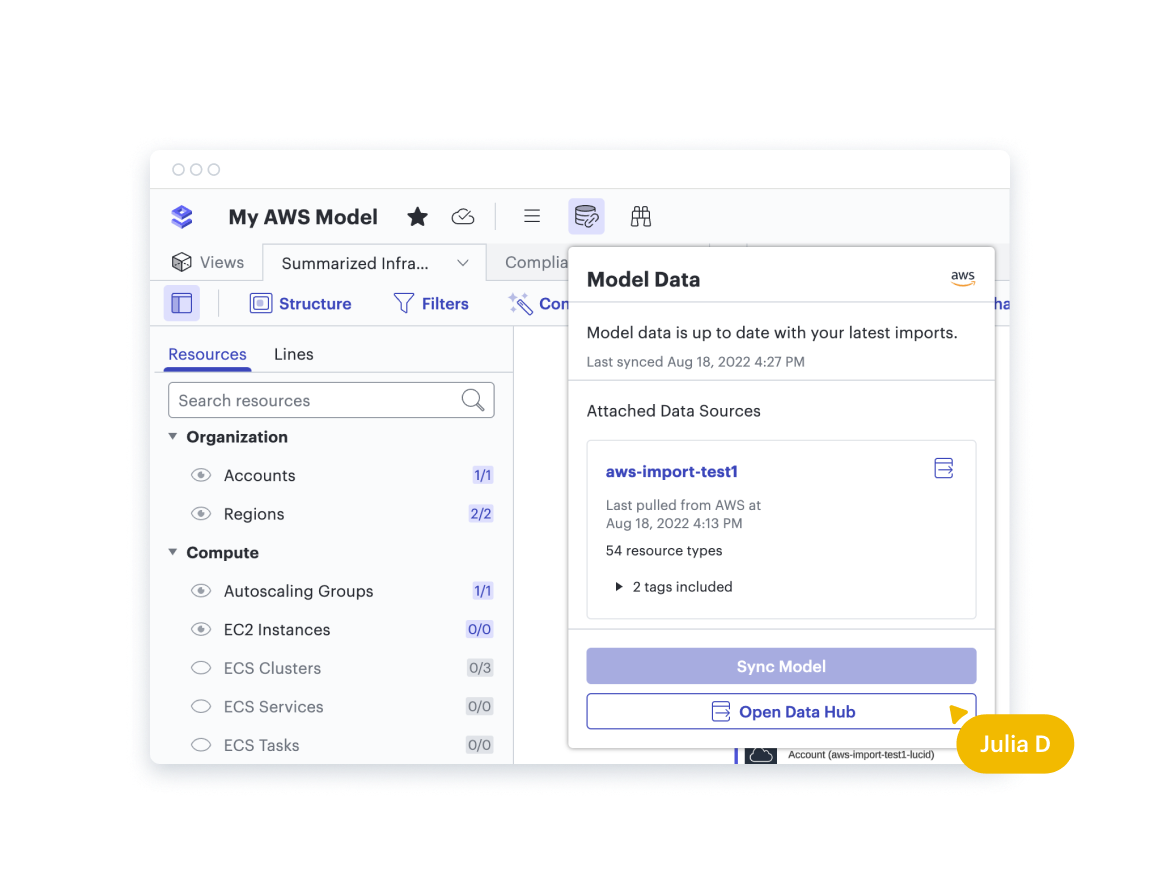
Lucid makes this process seamless: Simply refresh your diagram to automatically view your updated state. You can compare this diagram with your proposed future-state diagram to ensure all proposed changes were implemented correctly.
Streamline your cloud cost optimization techniques with Lucid
Lucid is the only work acceleration platform that combines virtual whiteboarding, intelligent diagramming, and cloud visualization into one solution that spans the entire cloud optimization process. With the Lucid Visual Collaboration Suite, you can use Lucidspark to brainstorm potential solutions, then use Lucidchart to diagram your current and future states, all in one place. Add the Cloud Accelerator to your account to better understand and optimize your cloud infrastructure.
Lucid streamlines cloud cost optimization by:
- Producing automatic and dynamic cloud documentation so you can get a comprehensive (and customizable) view of your architecture.
- Centralizing all communication in one space so there’s no need to jump between spreadsheets, your cloud console, or other applications to gain alignment. (For many organizations, this leads to tool consolidation.)
- Providing advanced functionality, like Collaborative AI and Visual Activities, to help teams move into action faster.

Ready to simplify cloud optimization?
Learn how to increase cloud visibility, improve cross-functional collaboration, and create effortless documentation with Lucid.
Request a demoAbout Lucid
Lucid Software is the leader in visual collaboration and work acceleration, helping teams see and build the future by turning ideas into reality. Its products include the Lucid Visual Collaboration Suite (Lucidchart and Lucidspark) and airfocus. The Lucid Visual Collaboration Suite, combined with powerful accelerators for business agility, cloud, and process transformation, empowers organizations to streamline work, foster alignment, and drive business transformation at scale. airfocus, an AI-powered product management and roadmapping platform, extends these capabilities by helping teams prioritize work, define product strategy, and align execution with business goals. The most used work acceleration platform by the Fortune 500, Lucid's solutions are trusted by more than 100 million users across enterprises worldwide, including Google, GE, and NBC Universal. Lucid partners with leaders such as Google, Atlassian, and Microsoft, and has received numerous awards for its products, growth, and workplace culture.
Related articles
The value of a single source of truth during cloud migration
In this blog post, we will explain why a single source of truth in cloud migration is important, and how to obtain it.
Lucid integrations guide: How to supercharge your tech stack
Explore Lucid's rich ecosystem of integrations with other popular apps you’re already using, and bring the simplicity of visual collaboration to your entire workflow.
Why CIOs should use visuals during cloud migration
Cloud migration projects can be challenging, complicated, and intimidating. Visuals can drastically improve the process.
The IT team’s toolkit for effortless documentation
Get over 15 templates to document systems, processes, and projects—without the hassle.
Bring your bright ideas to life.
By registering, you agree to our Terms of Service and you acknowledge that you have read and understand our Privacy Policy.