Implementing Agile principles and techniques helps your team improve processes, increase productivity, and add product value while releasing features that your customers need as quickly as possible.
To reach your goals, you need to know how much work your team can complete in a sprint. Knowing this type of information makes it easier to meet established deadlines and ensure that your team is working at a sustainable pace.
Let's review how you can calculate sprint velocity and how to use a sprint velocity formula to accurately estimate the amount of work that your team can complete in each sprint.
What is sprint velocity?
In Agile, sprint velocity is the estimate of how much work your team can complete in future sprints based on the amount of work completed in previous sprints. With this knowledge, you can plan and prioritize tasks, understand what you’ll need, and more accurately predict your team’s ability to meet deadlines.
Your sprint velocity calculation also gives senior management and other stakeholders a better idea of when to expect product delivery.
How do you calculate velocity in Agile?
In order to calculate sprint velocity and estimate what work can be completed in the future, you need to measure the work that has previously been done. To get an average measurement of work that has been done, plan to review your previous three sprints.
If your team is new to Agile development and you don’t have previous sprints to look at, you’ll need to complete a few sprints. Then, you can gather useful data to help calculate an average.
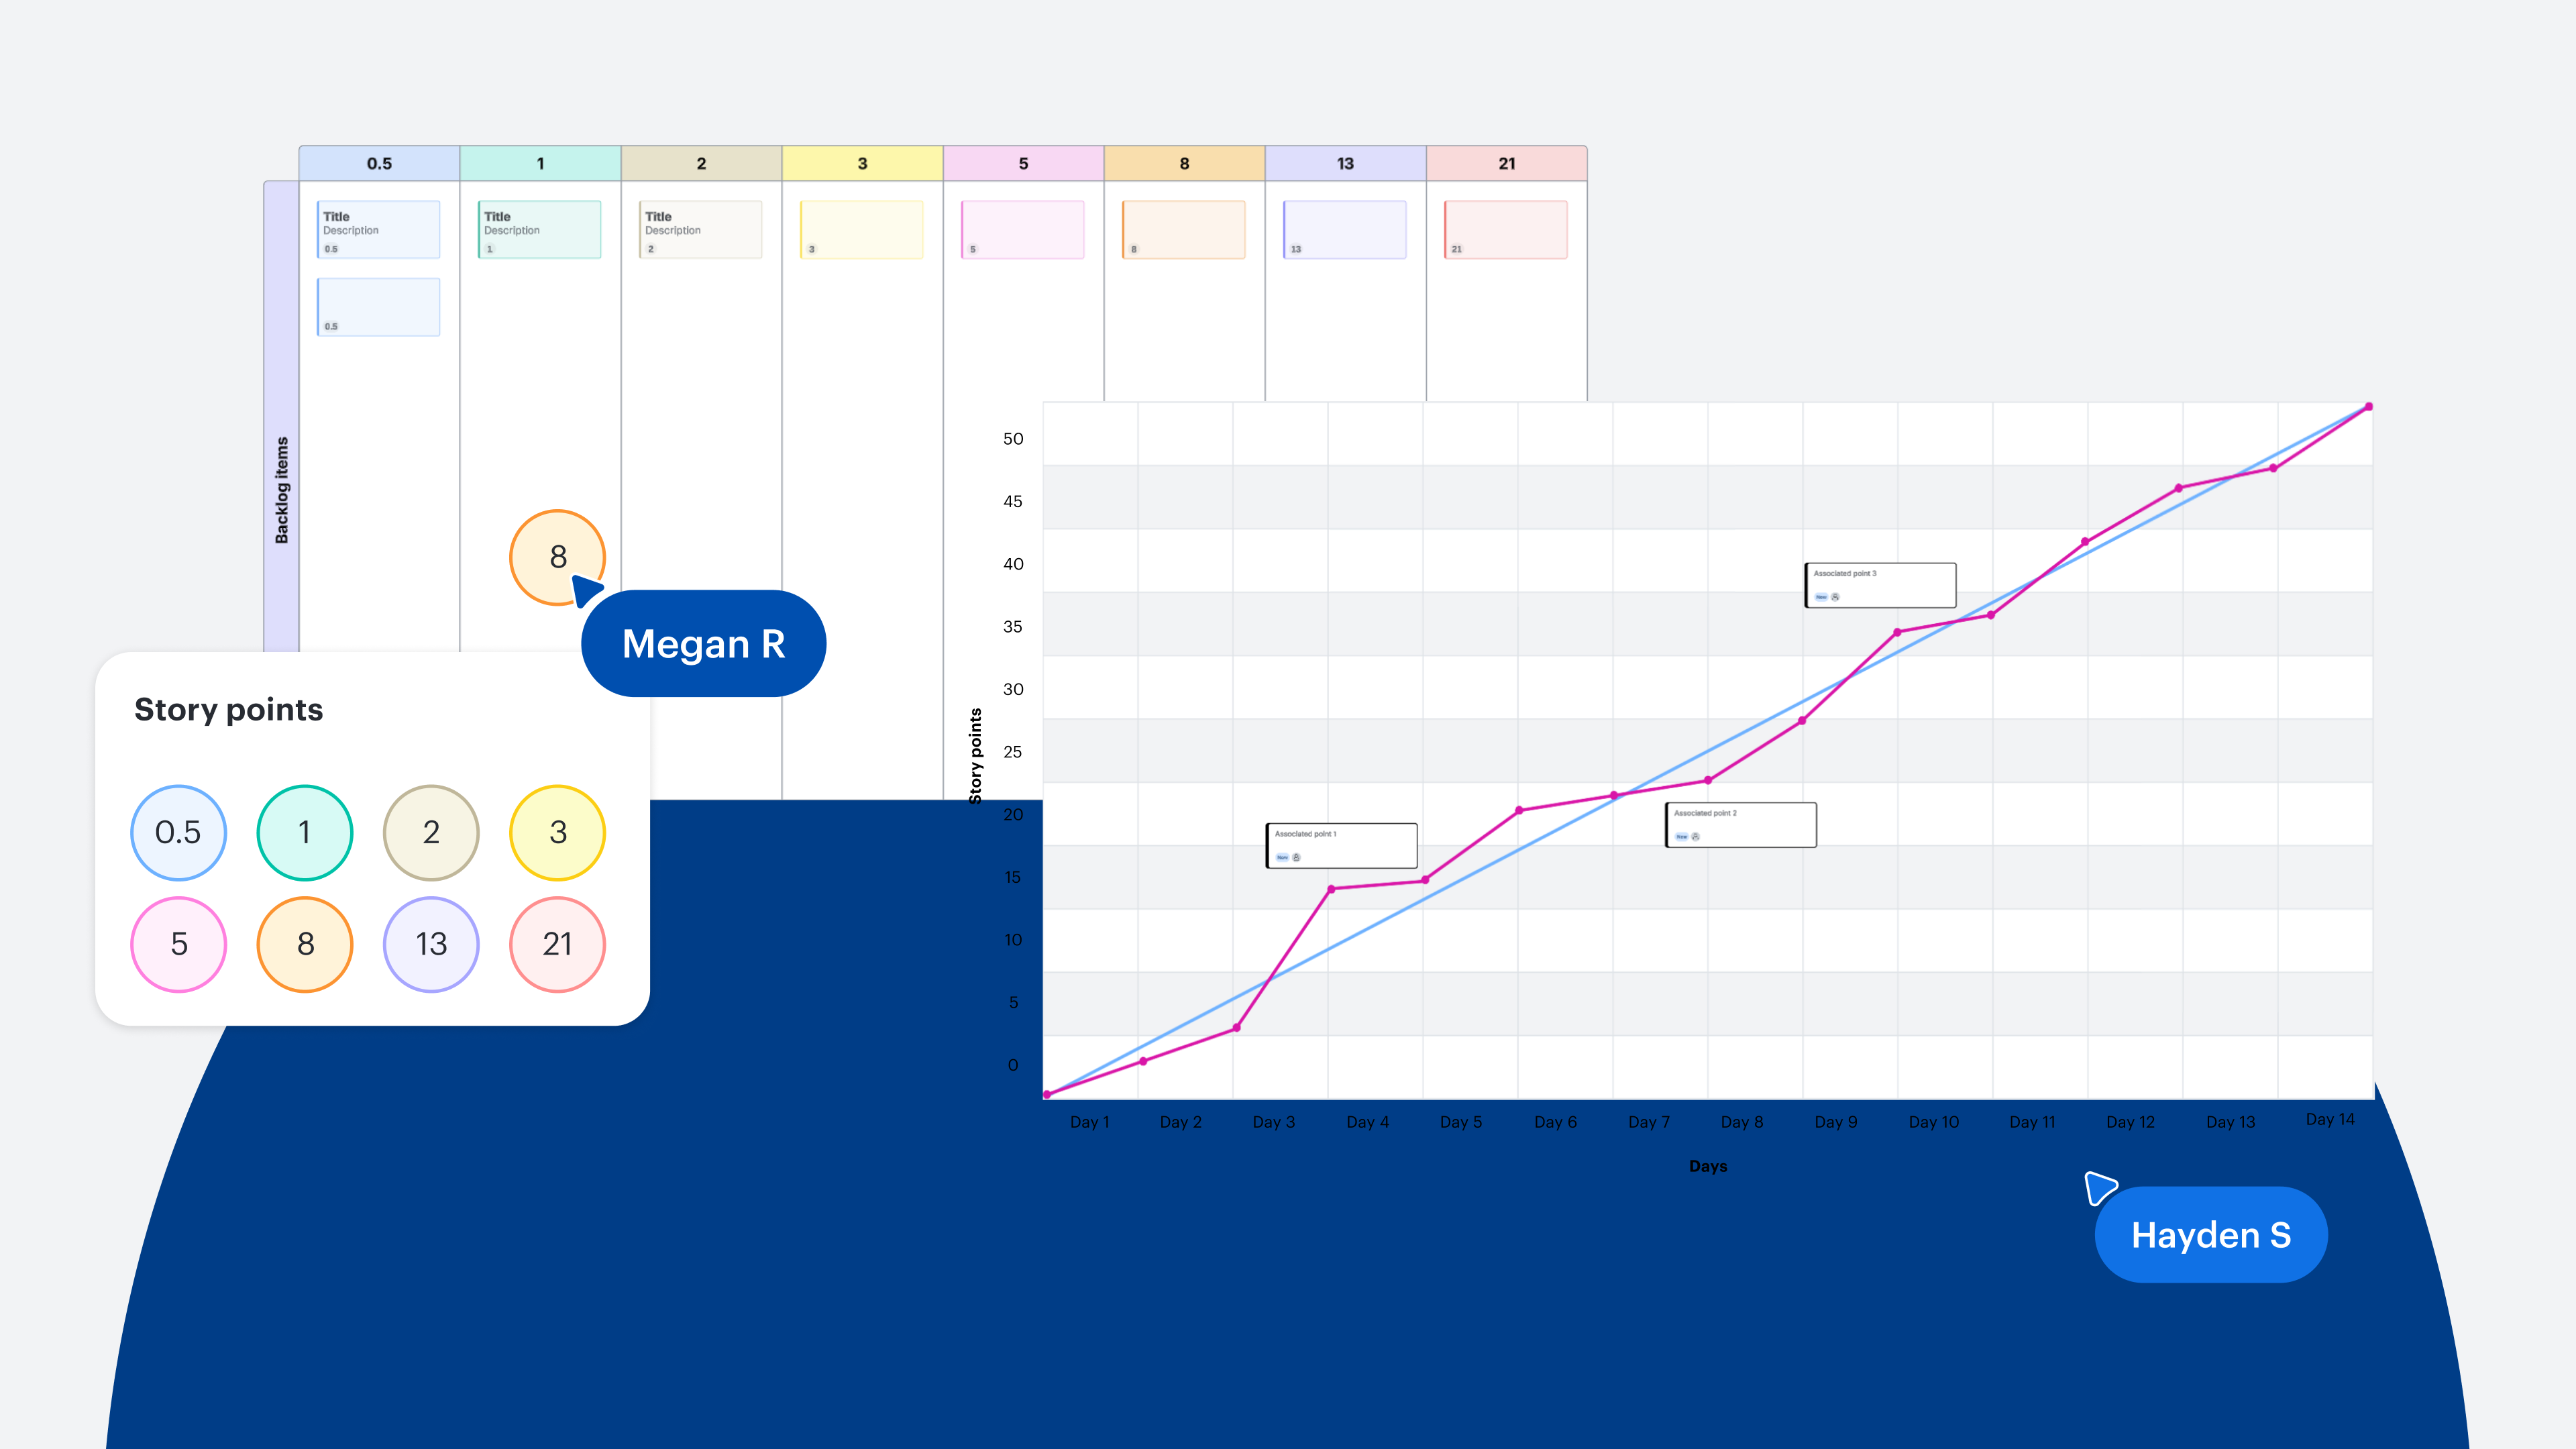
In the following example, we will use story points to measure the amount of work completed in each sprint. A story point is a measurement used by Agile development teams to estimate how much effort it will take to deliver a user story.
Step 1: Count how many user story points have been completed during each sprint
At the end of a sprint, add up how many story points the team completed.
For example, assume that during sprint 1:
-
The team committed to completing five user stories.
-
Each user story had eight story points for a total of 40 story points. (While it’s unlikely that each user story will have the same estimation of effort, we will use the same number of story points per user story to simplify our example).
-
The team completed three of the five user stories.
In sprint 2:
-
The team committed to seven user stories (including the two that were not completed in sprint 1).
-
Each user story had eight story points for a total of 56 story points.
-
The team completed four of the seven user stories.
In sprint 3:
-
The team committed to nine user stories.
-
Each user story had eight story points for a total of 72 story points.
-
The team completed five of the nine user stories.
Step 2: Calculate the average of completed story points
The sprint velocity formula is easy: Simply add up the total of story points completed from each sprint, then divide by the number of sprints.
Sprint 1: 3 user stories x 8 story points = 24
Sprint 2: 4 user stories x 8 story points = 32
Sprint 3: 5 user stories x 8 story points = 40
Total = 96
So, your average sprint velocity is 96 divided by three, which is 32.
You can now base the amount of work to be done in future sprints on the average of 32 story points. If you have 160 story points of planned tasks remaining to complete, for example, you can assume that your team will need another five sprints to finish those tasks.
Remember: Sprint velocity is just an estimate. Your team will experience variables from sprint to sprint, such as team size, task complexity, and scope. Sprint velocity calculation is a great starting point to help you determine how much work your team can do before you factor in other variables.
Track progress with visuals
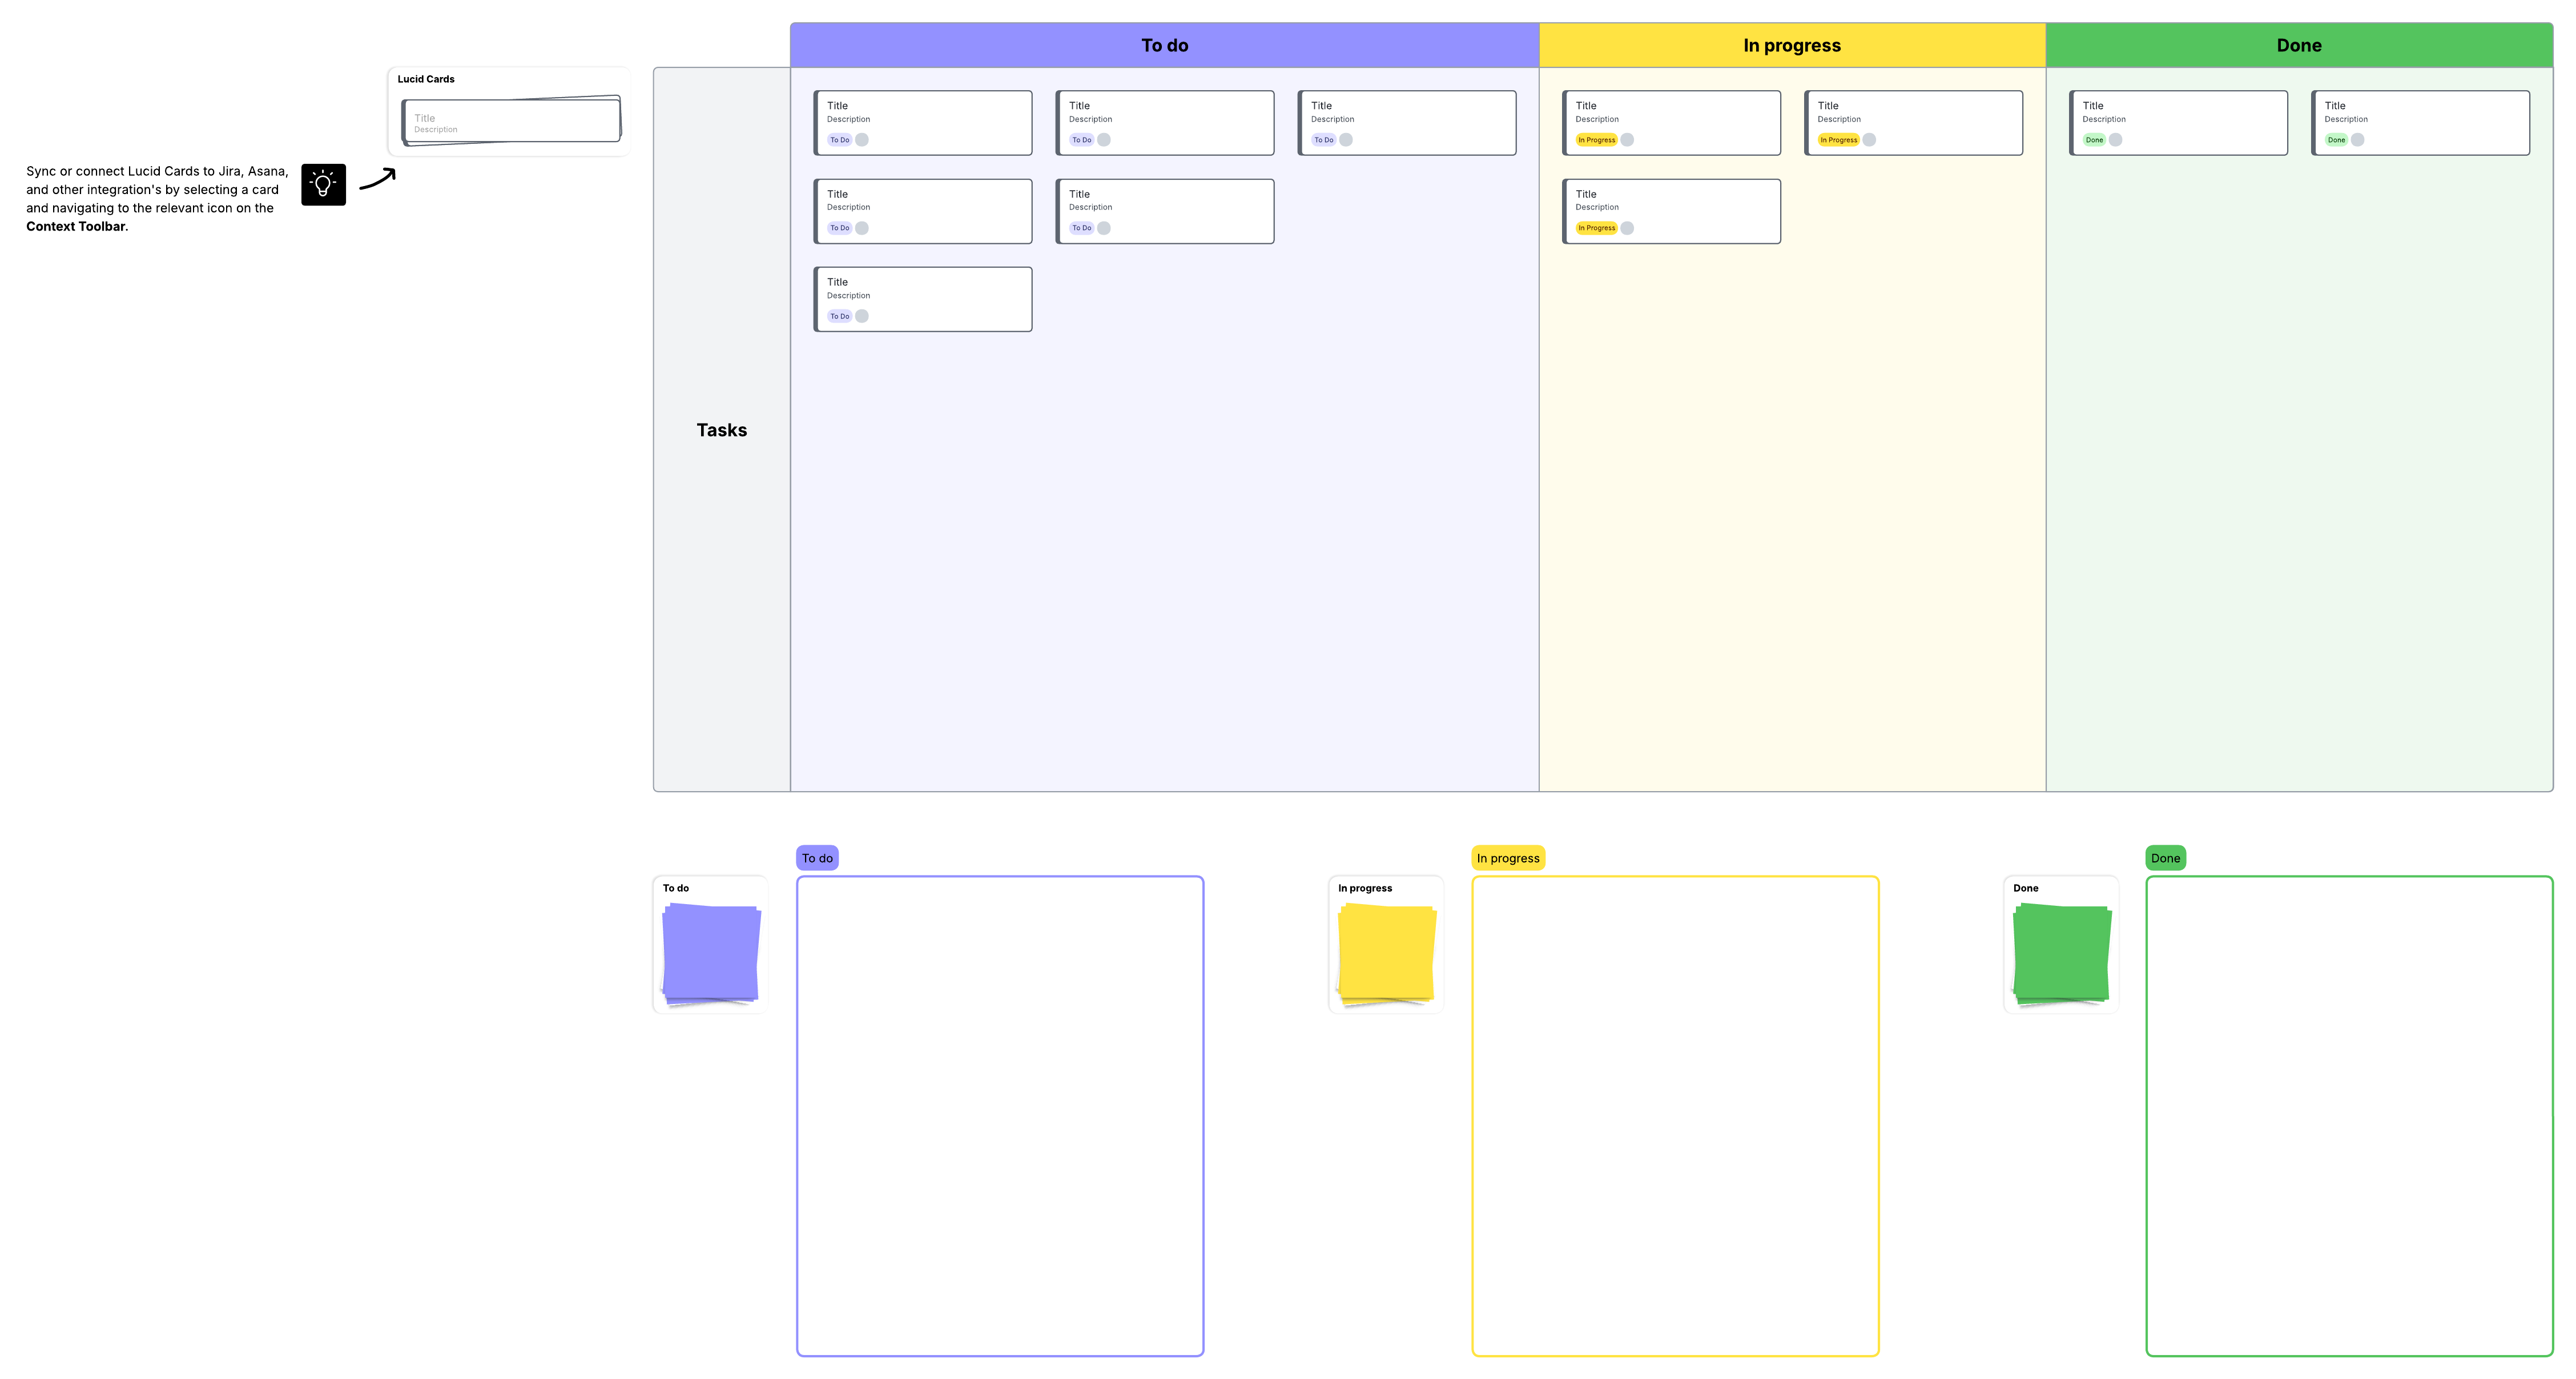
There are several Agile workflow management tools that you can use to track your team’s progress, such as velocity charts, burndown charts, and Kanban boards. These visual tools should be cloud-based so they can be widely accessed and viewed, and you can keep a record of your progress to inform your sprint velocity calculation.
Velocity chart
A velocity chart is a graph that shows estimated story points against story points that were actually completed. Story points are measured on the vertical axis, and completed sprints are displayed on the horizontal axis.
This chart is a simple visual representation of your iteration’s progress. Its purpose is to help estimate team performance. The chart lets you visualize the overall status of tasks and how much work your Agile team can complete in future sprints.
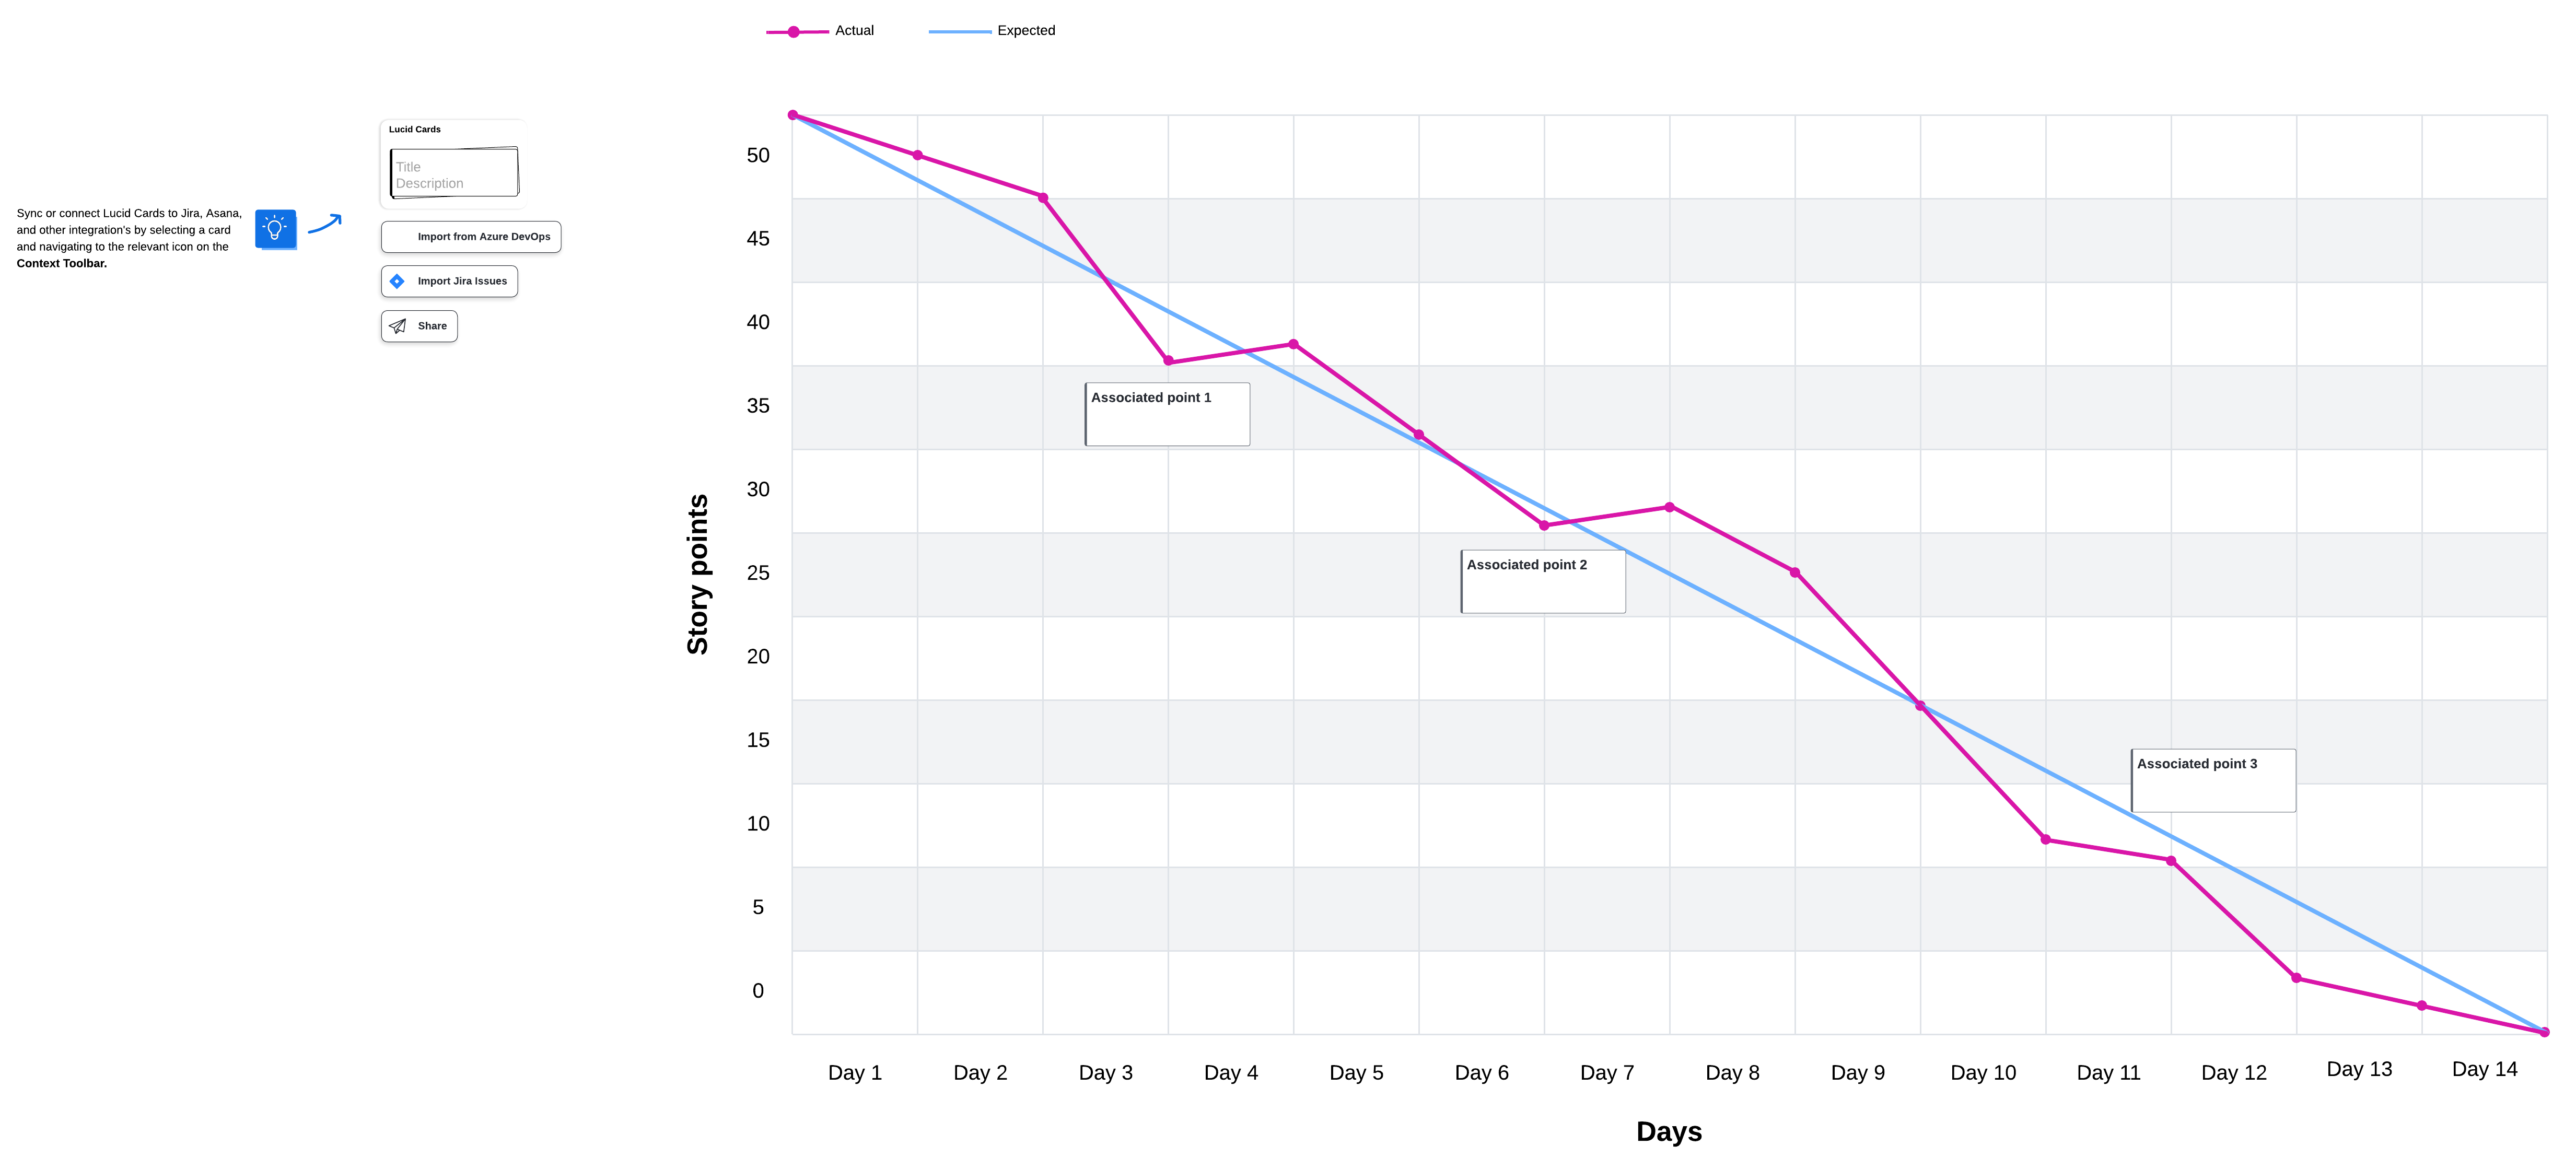
Velocity burndown chart
A burndown chart is a graph that shows the work that is planned to be completed in a sprint. Burndown charts allow teams to see how much work has been done, how much work is left to do, and how much time remains to complete the work. The burn rate estimates the amount of work that is done and the required rate of work based on the set time frame.
As tasks are completed, the graph “burns down” to zero on or before the last day of the time period.