With timeline software, you can create organized timelines that align your team on project progress, easily outline historical events and movements, or help educate visual learners with easy-to-use visual aids. This guide will cover everything you need to know about timelines, how they’re used, and how to create the timeline you need.
What is a timeline?
A timeline is a visual representation of a chronological sequence of events within a story, process, or history. Presented in either a horizontal or vertical format, timelines provide users with a simplified way to understand how various events, people, and actions have played or will play a role in any given process or period of time. Timelines can also be combined with text and graphics to produce infographics, which can easily convey statistics, historical events, and other information. In project settings, timelines are often used as a high-level “map” of the work showing what happens when, and what needs to be completed before the next step can begin.
Types of timelines
You can select from a number of different timeline options and formats when deciding how best to visualize your information. Here are some of the most common timeline types to choose from:
-
Horizontal timeline: Horizontal timelines present information in chronological order from left to right. These are also called chronological timelines.
-
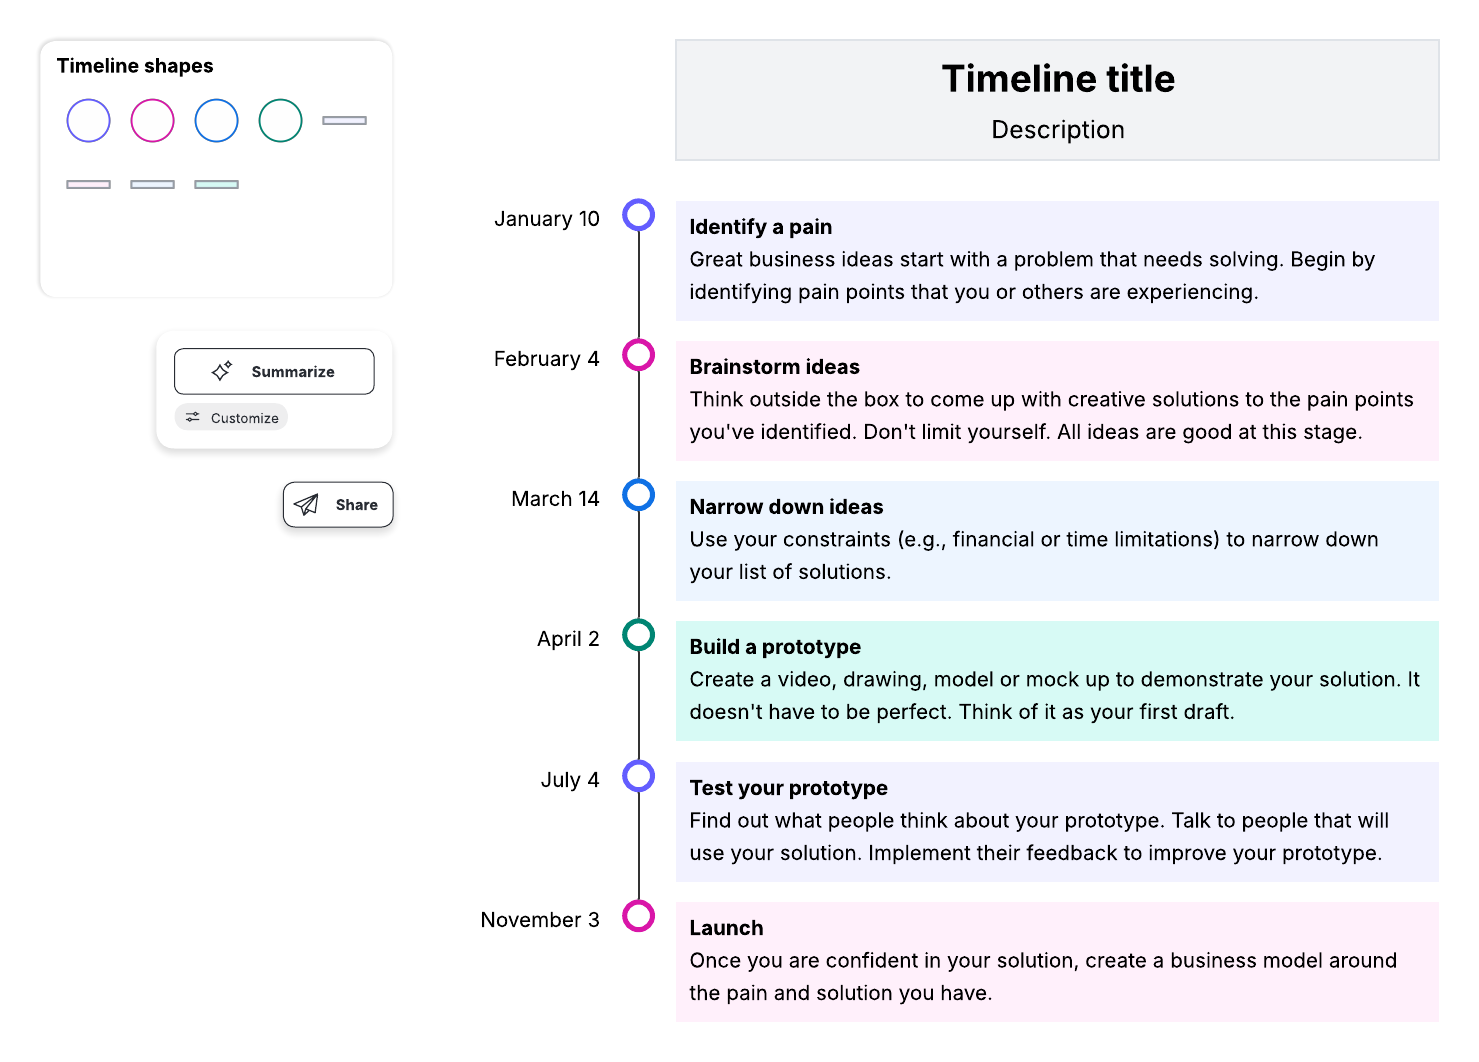
Vertical timeline: In vertical timelines, information is presented chronologically with the first event at the top of the page and the last at the bottom. Events and other information are added using horizontal branches off of either side.
-
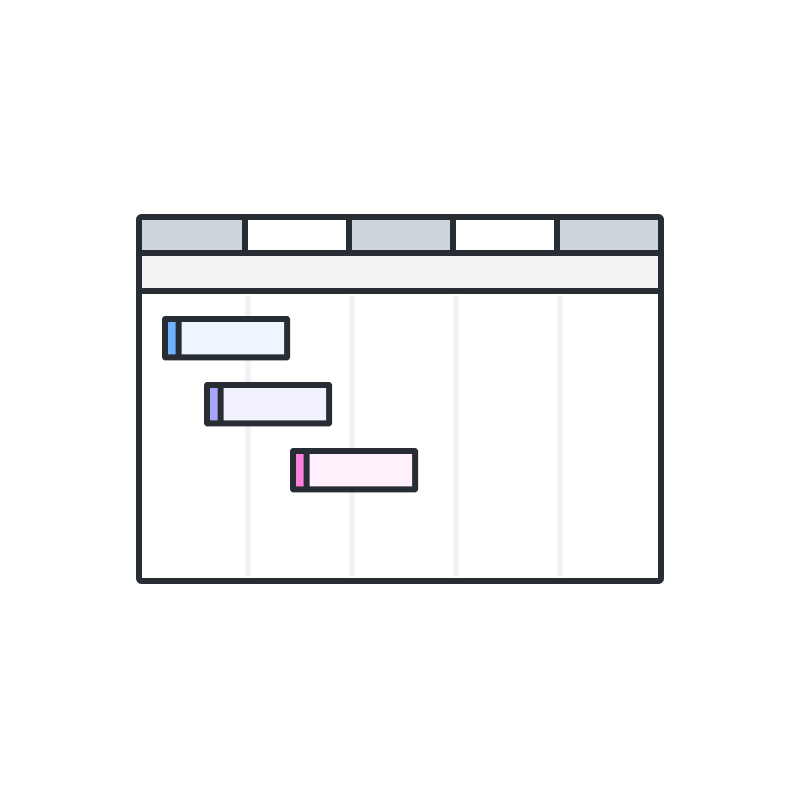
Gantt chart timeline: The Gantt chart timeline is a horizontal bar chart used to visually track the progress of a project over time. It's ideal for managing projects of any size and coordinating tasks, including task duration, dates, and resources.
-
Dynamic timeline: Dynamic timelines allow the user to navigate and manipulate dates in real time. They're best for visualizing and analyzing large amounts of data, possibly over a large span of time.
-
Static timeline: Both chronological timelines and vertical bar chart timelines are examples of static timelines. All of the data is presented all at once on a static plane, and the information does not change or move.
-
Vertical bar chart timeline: A vertical bar chart timeline can be used to track time against amounts, such as money or company growth. Their upward motion provides a quick visualization of gains and/or losses, making them ideal for business analysts or financial teams.
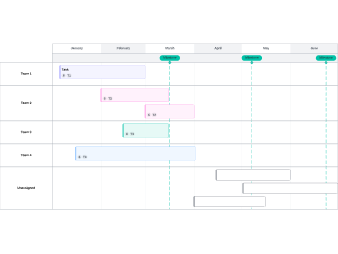
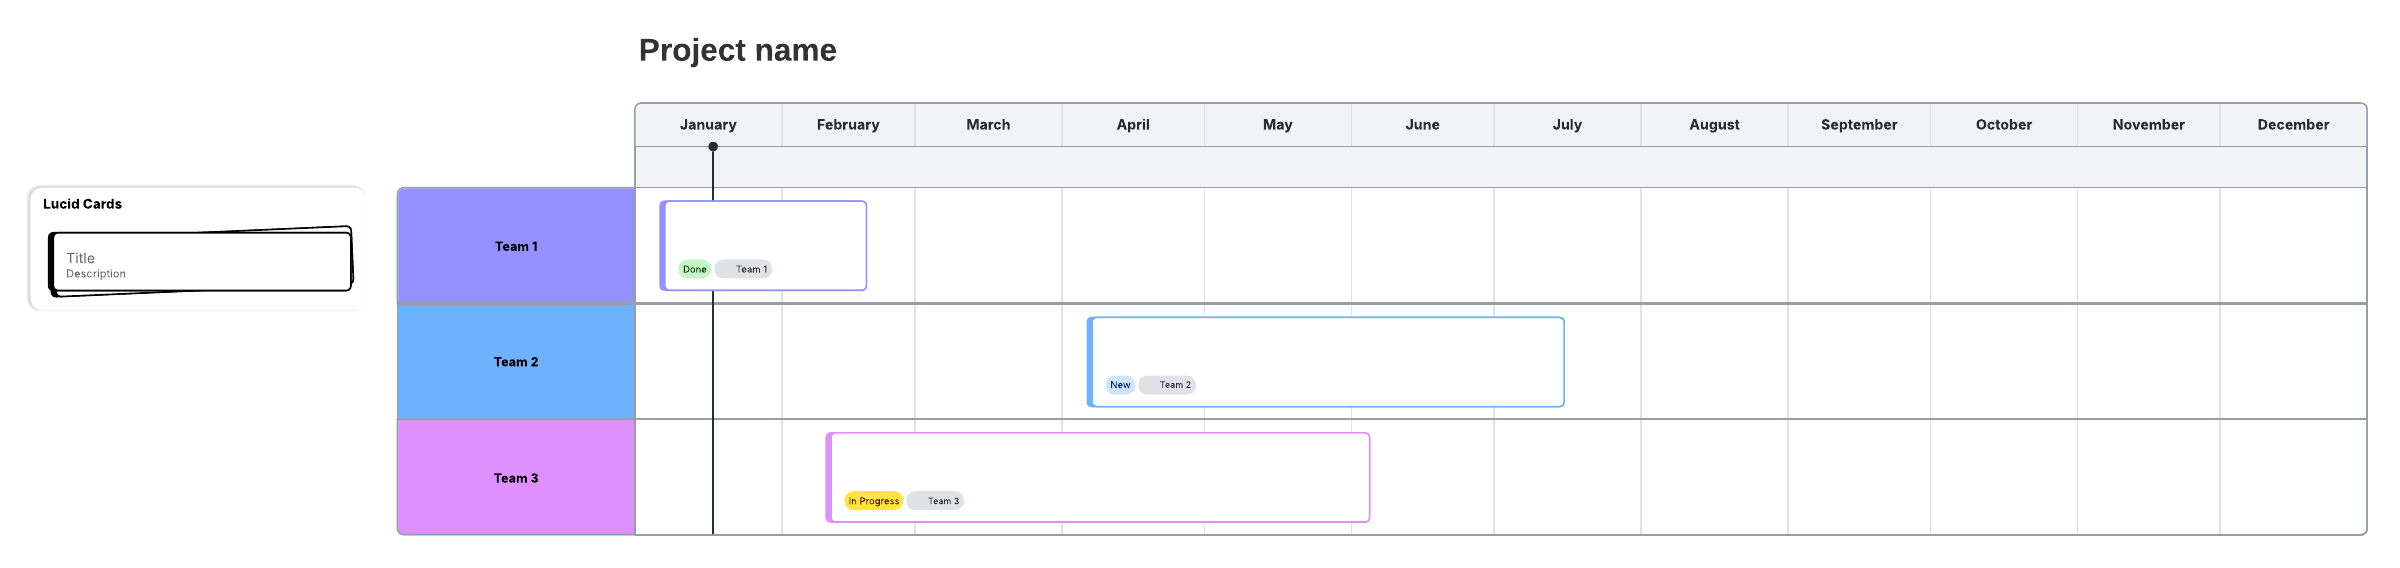
You may also hear people describe project timelines by their visual structure, especially when deciding how to present work across owners or teams. Use the structure that best fits your project. Basic line timelines help identify key milestones, where block timelines make it easy to visualize teams and specific task progress.
Timelines vs. Gantt charts
If you’re building timelines specifically for project planning and execution, it also helps to distinguish between a simple project timeline and a Gantt chart. Both project timelines and Gantt charts provide a project overview, but they serve different purposes.
A project timeline provides managers and teams with a quick, at-a-glance context for where the project stands and what is coming up next. A Gantt chart is more detailed and takes timelines a step further to include task dependencies, priorities, and time estimates. Both are effective tools for project managers, but timelines are best for getting a quick overview of a project’s progress, especially for sharing with stakeholders and leaders who aren’t in the weeds. Gantt charts, on the other hand, offer more in-depth detail for day-to-day management.
Components of a timeline
Timelines are made up of four basic components:
-
Dates: Mark when a specific event takes place on a timeline
-
Descriptions: Describe a given event
-
Headers (optional): Provide additional context to a timeline when added alongside a description
-
Images (optional): Add visual interest and additional information
In addition to these four elements, timelines include the following images and symbols:
|
Symbol name
|
Description
|
|---|
|
Line bar
|
Used to depict an event, progress, or story from beginning to end.
|
|
Milestone
|
Used to represent events or milestones. Often shows a date.
|
|
Time bar
|
Used to represent a specific length of time.
|
|
Interval
|
Used to represent the time that elapses within the timeline sequence.
|
A project timeline in particular includes these key elements as well:
Benefits of using a timeline
Timelines are popular both in business and education, and they offer a wide range of benefits. Not only do they provide a clear and organized means of recording and tracking data and events over time, but they also help users to quickly and easily comprehend and retain a wide range of information.
Timelines can benefit you in the following areas.
Timelines for history
The timeline's simple structure and ability to depict events and change over time make them particularly useful when studying history. With a timeline, students can effectively visualize the individual events that make up conflicts, social movements, biographies, and other historical occurrences. The visual nature of timelines also makes them useful study tools that can aid in memorization and learning.
Timelines for reading comprehension
Reading comprehension involves an understanding of character development, cause and effect, significance, and the basic beginning-middle-end story structure. Educators can use timelines to clearly outline these components and help students easily identify patterns and significant events within a story. Visual learners in particular can benefit from seeing a story laid out chronologically.
Timelines for project management
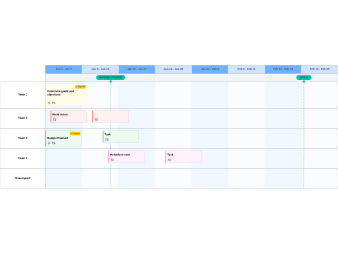
Visuals can play a crucial role in keeping your team aligned on project goals and progress. Project timelines offer a visual record of milestones, tasks, and ownership, providing shared context for teams to succeed.
Timelines can help project managers in the following ways:
-
Optimize planning and execution: By mapping out tasks and dependencies, you lay a foundation that improves planning quality and prevents expensive bottlenecks before work piles up.
-
Boost cross-team visibility: Timelines provide a high-level view of progress and deadline expectations. This clarity allows departments to collaborate more effectively and keeps stakeholders informed.
-
Analyze historical performance: Comparing project timelines side by side helps you identify what worked and what didn’t, providing the context needed to improve future workflows.
-
Streamline brainstorming: A visual record makes it easier to brainstorm during the planning phase and quickly gain context on where a project stands and what comes next.
How to make a project timeline
You can make a timeline in Lucidchart, Google Docs, PowerPoint, Word, Excel, and more. Regardless of the software you use, follow these steps to build your own.
Phase 1: Preparation
-
Define project scope: Write a scope statement outlining your final deliverables. For example, if you are a gardener, your final deliverables may be a 90-square-foot vegetable garden producing tomatoes, peppers, and kale.
-
Create a work breakdown structure (WBS): Divide large deliverables into smaller chunks, or work packages. Continuing our garden example, let’s say you’d like 30 square feet of each vegetable.
-
Identify tasks and dependencies: List the steps needed to finish each work package. Identify dependencies, or tasks that cannot start until another is finished. For example, you cannot plant until you purchase seeds.
-
Estimate time and resources: Estimate how long each task will take. Adjust for resource availability, remembering that a simple task can take longer if you have other commitments as well. For example, if planting each vegetable will take one hour each, you could estimate that you need to set aside three hours for planning. However, if you’ll be dog-sitting for a friend the week of planting, you may want to set aside extra time for disruptions.
Phase 2: Create the timeline
-
Set a scale: Use your software to draw a horizontal line. Decide on intervals (hours, weeks, or years).
-
Plot milestones: Use distinct shapes, lines, or icons to mark major achievements. These help you stay on track and visualize progress.
-
Add task details: Insert text boxes with brief descriptions, owners, and deadlines.
-
Contextualize: Add visuals or color-coding to designate different teams or work streams.
Keep the following tips in mind as you work:
-
If stacking multiple timelines, only place labels on the bottom row to reduce clutter.
-
A timeline isn’t a one-time deliverable. Review yours regularly to adjust for shifting workloads or team changes.
-
If you alter your timeline, make sure to do so in complete units only (e.g., full weeks vs 1.5 weeks).
Timeline examples
Take a look at the following template examples that you can use to make a customized timeline effortlessly.
Timeline template
This very simple layout is ideal for depicting important milestones in chronological order, labeled by month.