Key takeaways
An organizational chart is a visual diagram that shows the structure of a company, including roles, departments, and reporting relationships.
Organizations use org charts for workforce planning, restructuring, resource allocation, onboarding, and improved communication across teams.
The first modern org chart was created in 1855 by Daniel McCallum, and the format became widely adopted in business during the 1920s.
The three main types of org charts are hierarchical (pyramid structure), matrix (multiple reporting lines), and flat (minimal management layers).
Org charts have limitations. They can become outdated quickly, show only formal reporting relationships, and fail to capture informal networks or management styles.
Lucidchart makes it easy to build org charts manually or by importing data from a spreadsheet.
An organizational chart gives you a clear picture of how your company is structured. It maps out roles, departments, and reporting relationships so everyone understands who does what and who reports to whom. Whether you're onboarding new hires, planning a restructure, or simply clarifying team responsibilities, an org chart helps you communicate your organization's hierarchy at a glance.
What is an org chart?
An org chart is a diagram that shows the internal structure of an organization.
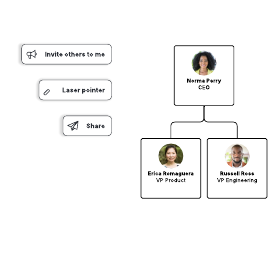
Each box or shape in the chart represents a person or role, often including details like job titles, photos, and contact information. Lines connect the boxes to show reporting relationships. Solid lines typically indicate direct authority, while dotted lines show secondary or informal connections.
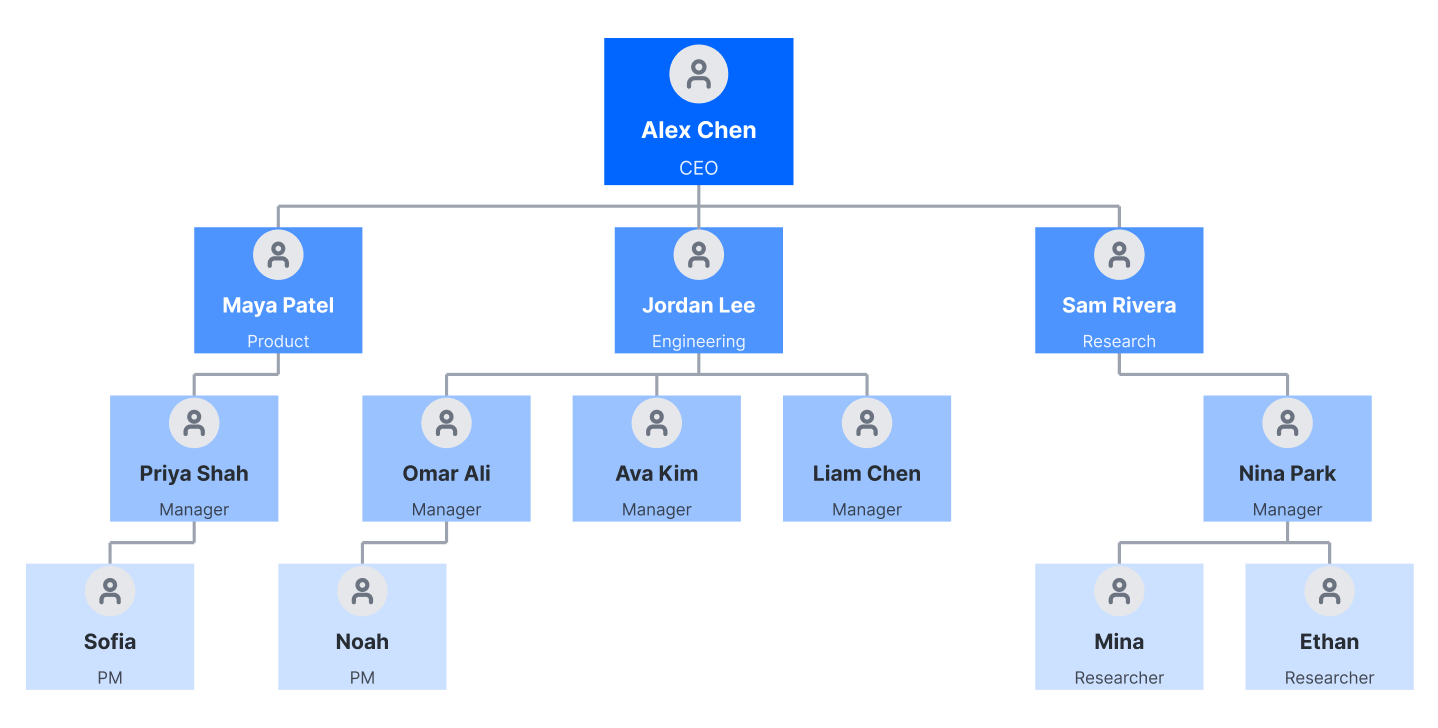
Org charts are also called organization charts, organograms, organigrams, or hierarchy charts. Despite the different names, they all serve the same purpose: making your company's structure visible and easy to understand.
What is an organizational chart used for?
Org charts serve multiple purposes across HR, operations, and strategic planning.
The most common uses include:
Communication and onboarding: New employees can quickly learn who's who, understand team structures, and identify the right contacts for questions.
Restructuring: When reorganizing teams or departments, an org chart helps you visualize current and proposed structures side by side.
Workforce planning: HR teams use org charts to identify gaps, plan for succession, and track headcount across the organization.
Resource planning: Project managers can see where capacity exists and who has the skills needed for upcoming work.
Genealogy: Outside of business, org charts work well for mapping family trees and lineage.
What is the history of the organizational chart?
The organizational chart has roots in the mid-19th century and became a standard business tool in the early 20th century.
In 1855, railway general superintendent Daniel McCallum designed what's considered to be the first modern organizational chart. According to its title, this visual represented “a plan of organization” for the New York and Erie Railroad, “exhibiting the division of administrative duties and showing the number and classes of employees engaged in each department.”
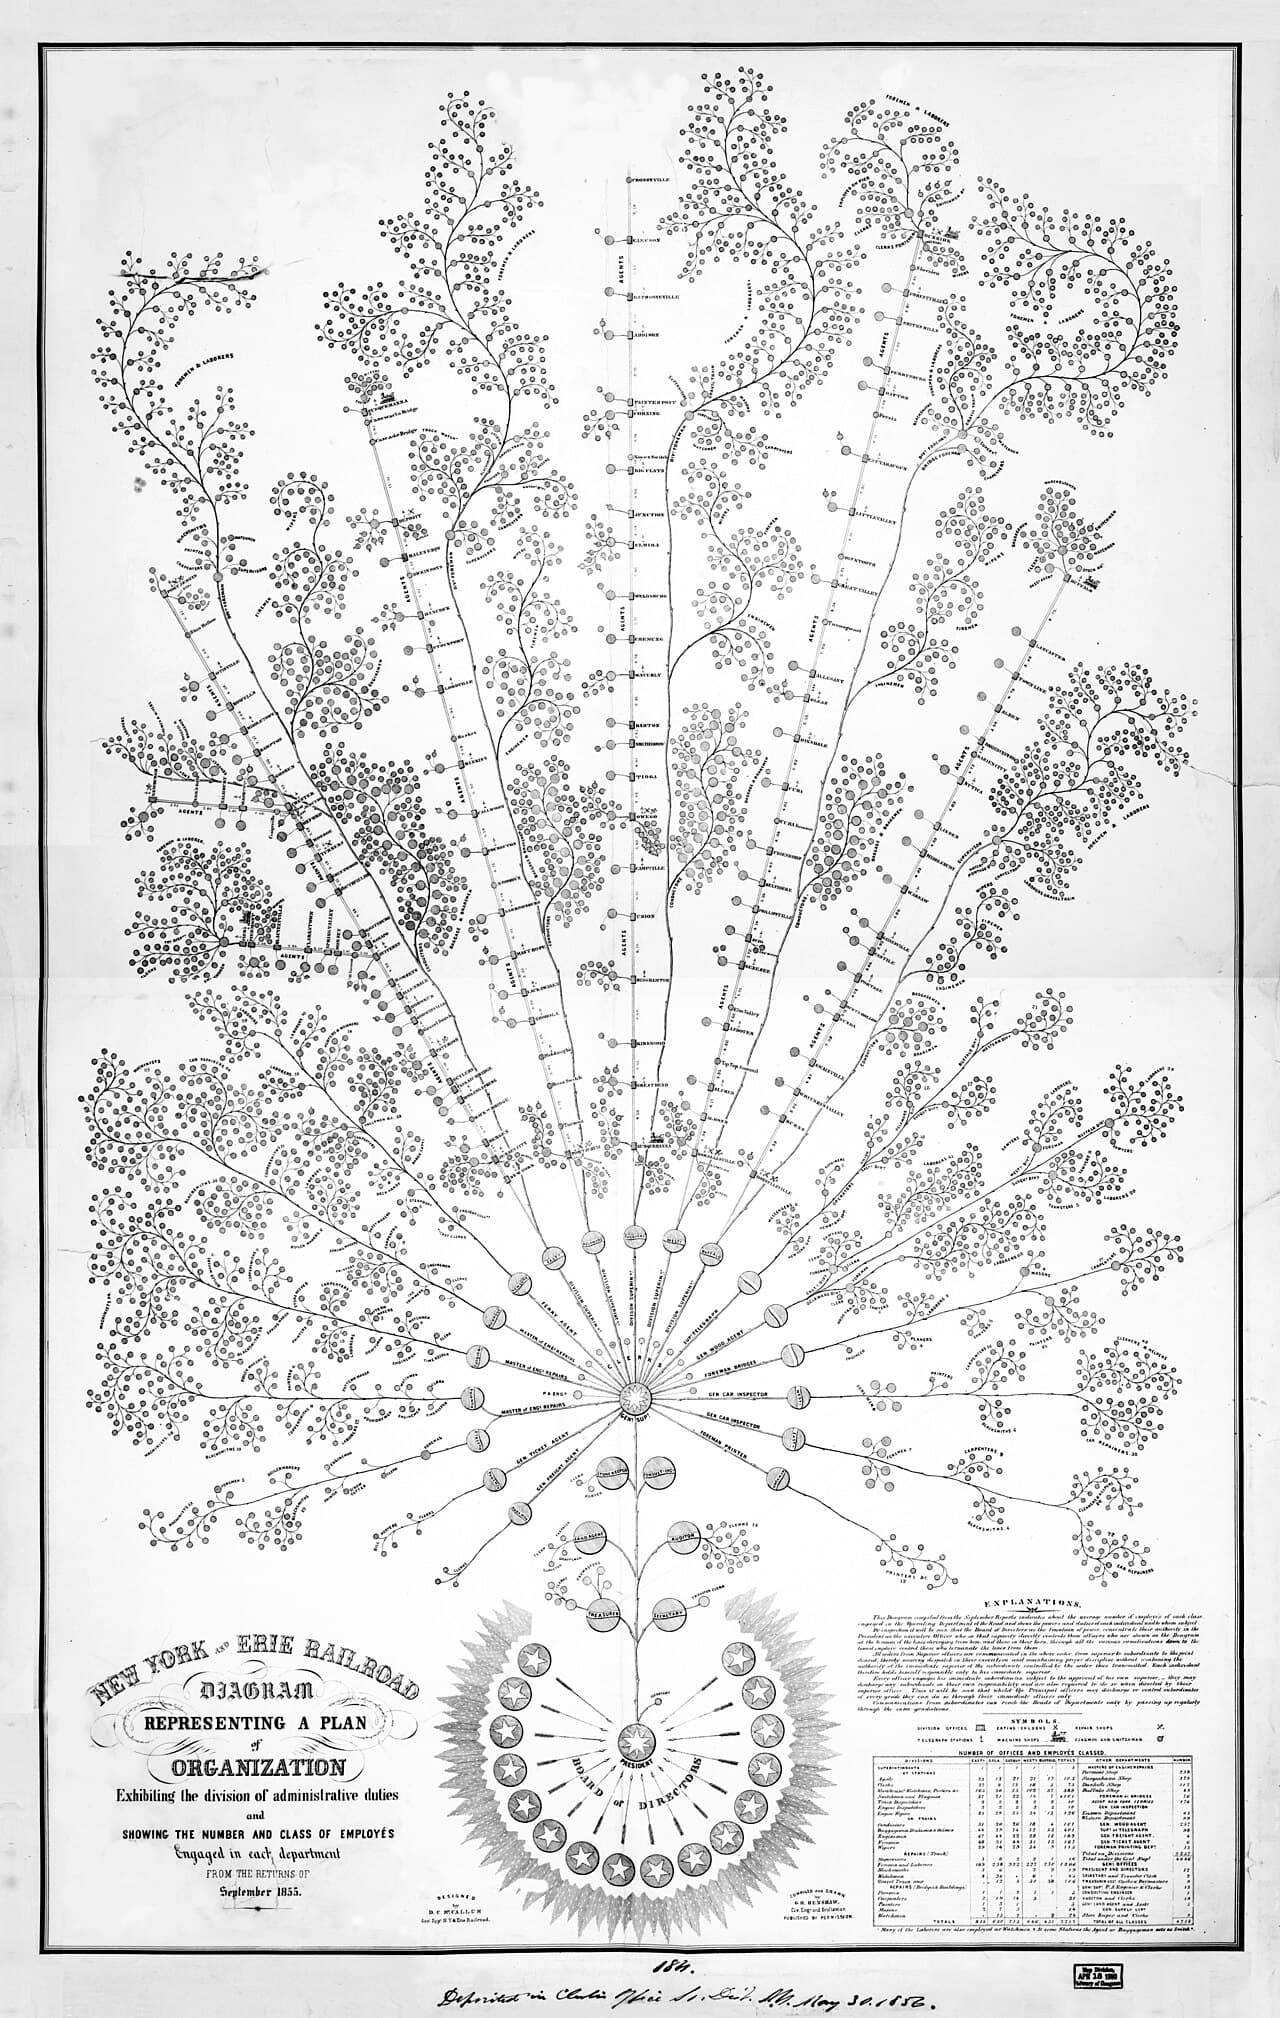
Despite these early beginnings, the term "organizational chart" took another 50 to 60 years to become commonly used. Consulting engineer Willard C. Brinton helped popularize organizational charts in his 1914 textbook, “Graphic Methods for Presenting Facts.” Charts were mainly used in engineering circles until the 1920s, when they began to get used more broadly throughout business.
The related terms "organigram" and "organogram" came into use in the 1960s. A related diagram called an organigraph offers a less linear approach—it illustrates associations and opportunities among departments, products, and supply chains rather than strict hierarchies.
What are the main types of organizational charts?
The three main types of org charts are hierarchical, matrix, and flat. Each structure reflects different management philosophies and communication patterns.
Hierarchical org chart
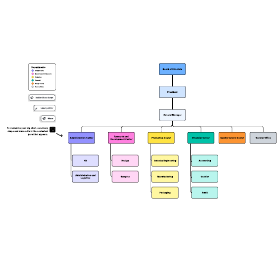
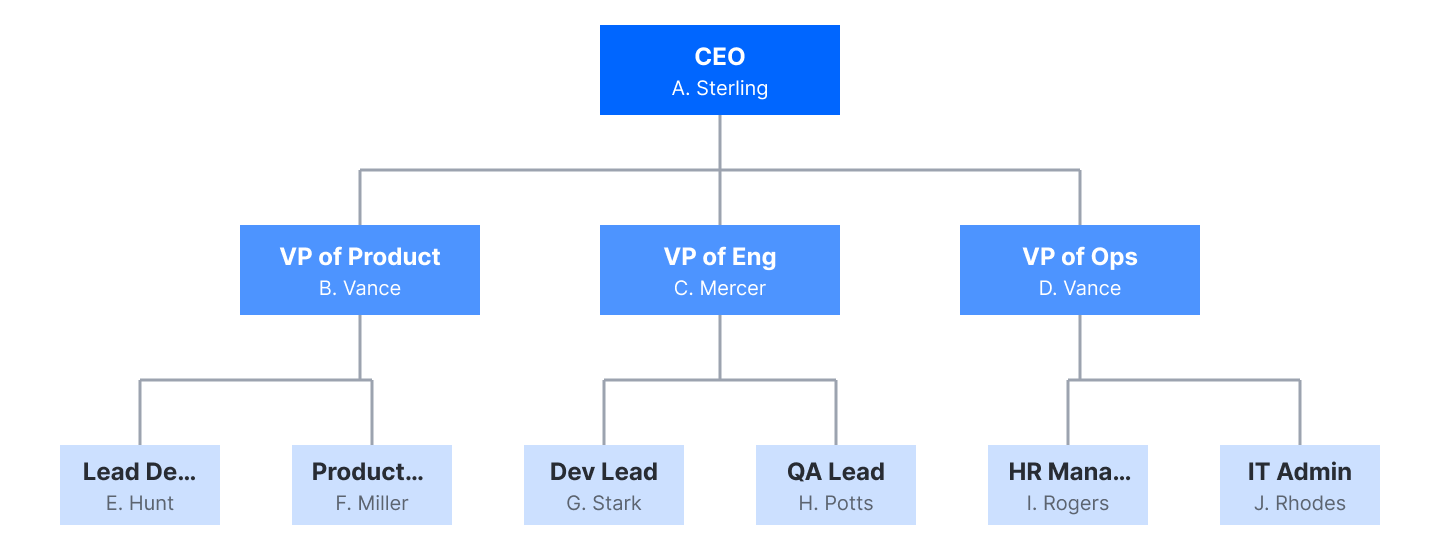
The hierarchical org chart is the most common type. It arranges people in a pyramid structure, with the CEO or top executive at the apex and layers of management below. Employees primarily communicate with their direct manager and their own direct reports. This structure creates clear lines of authority but can slow decision-making in larger organizations.
Matrix org chart
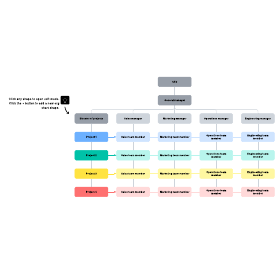
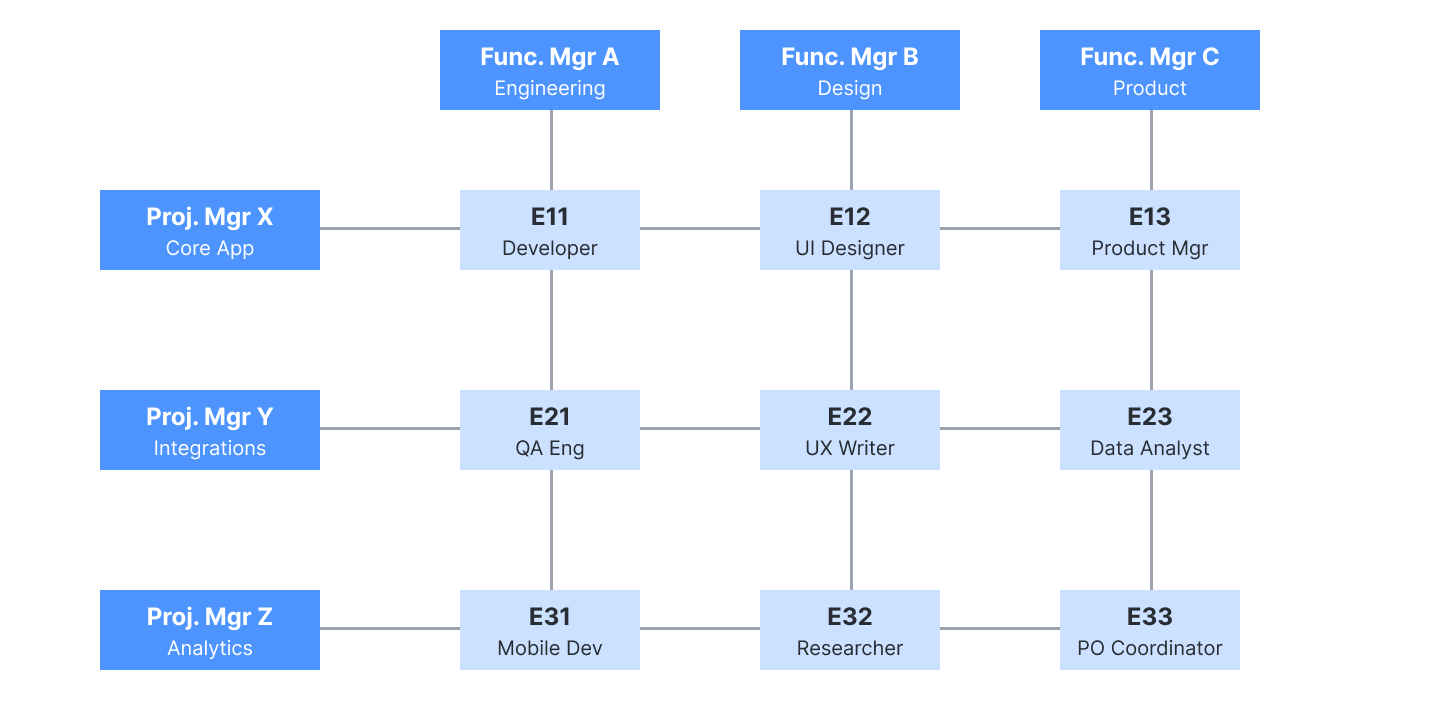
A matrix org chart shows employees who report to more than one manager. For example, a graphic designer might report to both a head of design and a project manager. This structure encourages cross-functional collaboration but can create confusion about priorities when managers have competing demands.
Flat org chart
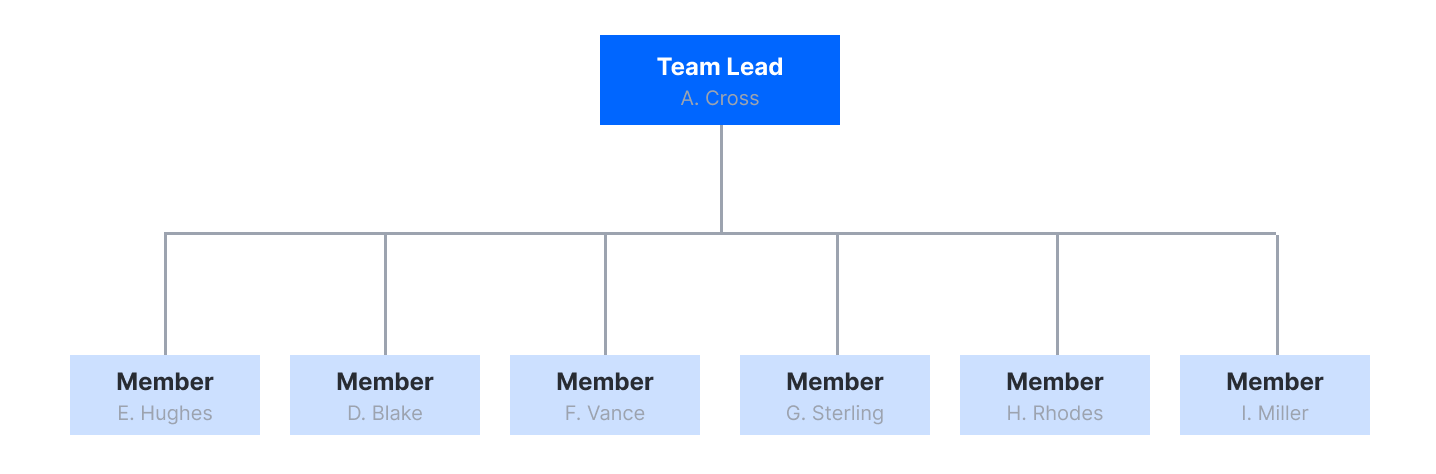
A flat or horizontal org chart has minimal middle management—often just two levels, with executives at the top and everyone else below. Startups and smaller companies commonly use this structure because it promotes autonomy and faster decision-making. However, conflicts can be harder to resolve without clear managerial authority.
In any org chart, solid lines represent the main chain of command, while dotted lines indicate secondary or informal reporting relationships.
What are the pros and cons of different organizational chart types?
Each org chart structure comes with trade-offs that affect communication, agility, and employee experience.
Hierarchical structures offer clarity and stability. Everyone knows who they report to and where decisions get made. The downside is rigidity, as layers of management can slow things down and create bureaucratic bloat.
Matrix structures foster cooperation across departments and make it easier to share resources. However, employees may struggle to balance the expectations of two different managers.
Flat structures cut management overhead and give employees more autonomy. Teams can move quickly without waiting for approvals. But without clear authority, conflicts become harder to resolve, and responsibilities can blur.
What are the limitations of org charts?
Org charts are helpful, but they have blind spots you should understand.
They go out of date quickly. Employee turnover, promotions, and restructuring can make an org chart obsolete fast. Mitigate this by using an editable, cloud-based diagramming solution like Lucidchart and setting up automated updates when possible.
They only show formal relationships. Org charts map official reporting lines, but they don't capture the informal networks that influence how work actually gets done. For sales and account management, you might complement your org chart with an account map that visualizes buying committees and stakeholder relationships.
They don't reflect management style. Two managers at the same level might lead very differently—one hands-off, another highly involved. The org chart won't show you that.
They may oversimplify complex organizations. For companies with fluid project teams or extensive cross-functional collaboration, an organigraph or similar diagram may better represent how work flows.
How can you make org charts more visual?
Adding visual elements makes org charts more engaging and easier to navigate.
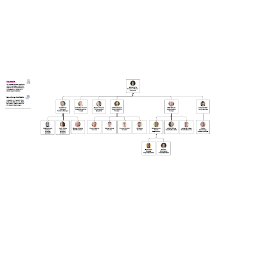
Photos help people get to know each other and connect names with faces, which is especially useful for remote teams or large organizations. You can also use different shapes, colors, and icons to distinguish departments, highlight leadership, or flag open positions.
Company logos and branding make org charts feel more polished when sharing externally. Some teams add interactive elements, such as hyperlinks to email addresses or profile pages.
How do you make an org chart in Lucidchart?
Lucidchart offers you two ways to create an org chart: build it manually or auto-generate it from your data.
Video showing adding org charts to a Lucid canvas
1. Build an org chart manually
If you are designing a proposed structure or don’t have an existing employee spreadsheet, you can build your chart directly on the canvas. Follow these steps to get started:
Enable the org chart shape library by opening the left panel, clicking the Search icon, then selecting Shapes > Browse all shapes > Org Charts > Use selected shapes.
Drag the org chart shape onto the canvas. Click the + icons on any side of a selected element to generate direct reports or peer roles connected by hierarchical lines.
To reassign an employee or move an entire branch, drag a shape over its new supervisor’s shape until highlighted. Lucidchart will automatically re-parent the node and reorganize its connected sub-tree.
Double-click any card to edit field values and add details of each individual in the chart. You can also hide or display specific fields across the entire chart using the right panel.
To get a head start, you can also use one of our org chart templates, opens in a new tab. We offer layouts for all kinds of company sizes and department types.
2. Auto-generate an org chart from data
If you already have employee records, importing a dataset is faster than creating an org chart from scratch. Lucidchart will automatically read your reporting structure and draw a diagram for you. You can import data via Google Sheets, Excel, CSV, or BambooHR.
To successfully import data, you’ll need to make sure your sheet adheres to the following formatting requirements:
The top row must contain clear header labels.
Your file must include two essential columns: a “Name” column and a “Supervisor” column. For the top executive, such as the CEO, leave the latter cell completely blank so that Lucidchart recognizes the root of the hierarchy.
Optional: You can also include extra columns for images, roles, and more.
To get started, follow these steps:
Go to the file menu and select File > Import > Data.
Select Org chart from the menu.
Click Import your data and upload your document.
Once the org chart has been generated, you can customize the layout by adding photos, color-coding departments or locations, and more.
Publish and share
Once your org chart is built, Lucidchart makes it easy to share with stakeholders in the following ways:
Export documents by downloading in a variety of file types, including JPEG, SVG, and PNG.
Embed diagrams in company documentation, Notion, or Confluence pages.
Insert dynamic org charts into documents and slides using our integrations, opens in a new tab for PowerPoint, Microsoft Teams, Google Workspace, and more.
For a complete walkthrough, see our step-by-step guide on how to make an org chart, opens in a new tab or learn how to make an org chart in Google Docs, opens in a new tab using Lucidchart's add-on.
How to create an org chart in Lucidchart