Keep IT teams and systems working together
Design, document, and optimize your technology infrastructure within the Lucid Visual Collaboration Suite. Ensure everyone has the tools they need to succeed.


Develop and deploy effective solutions
Work with stakeholders to brainstorm and plan complex hardware and software rollouts. Get aligned on priorities and timelines.
How IT teams use Lucid
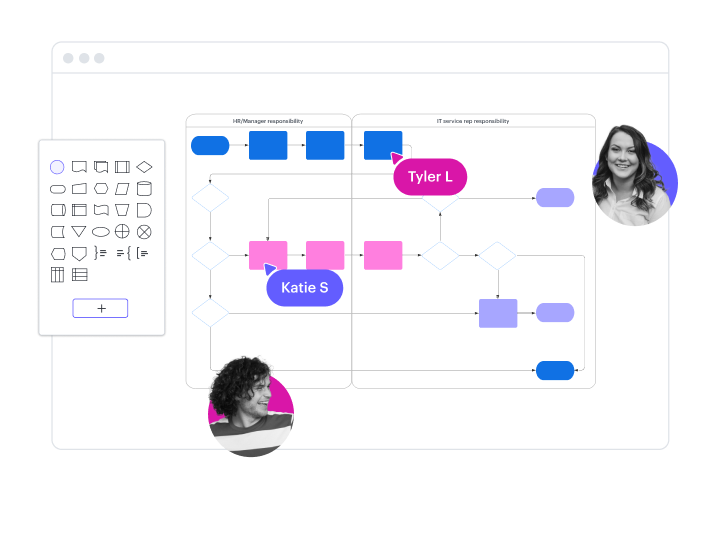
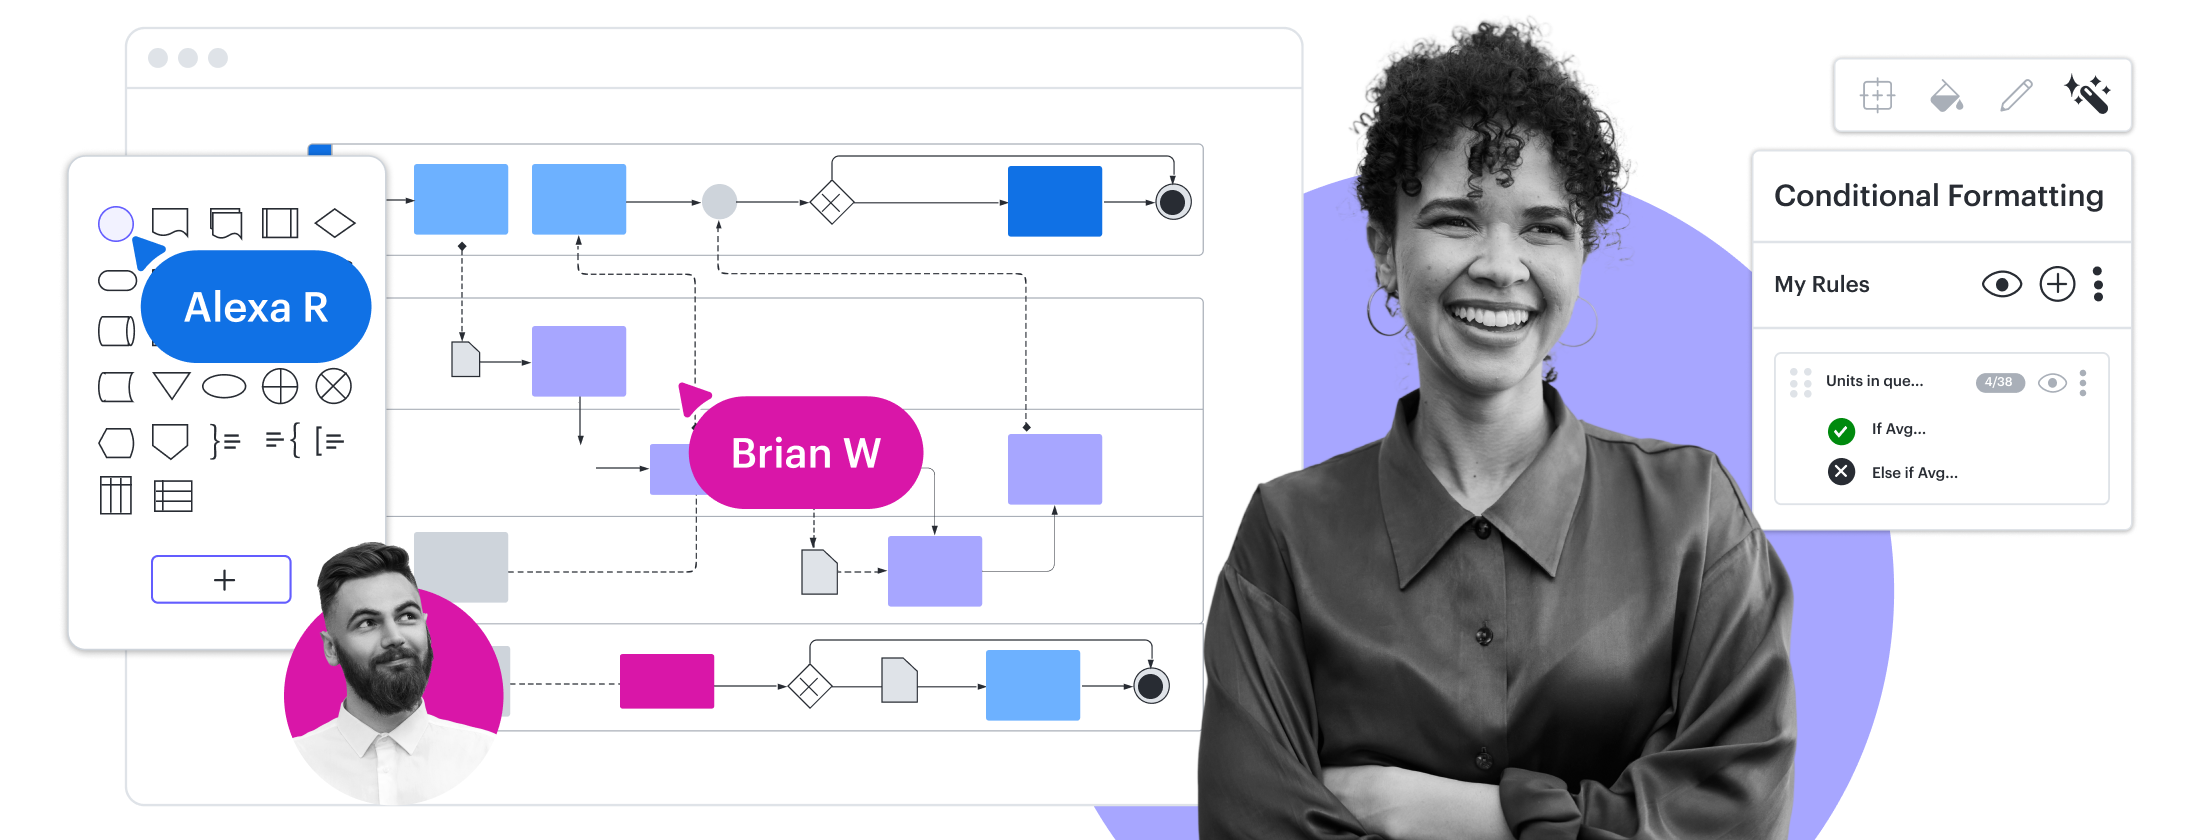
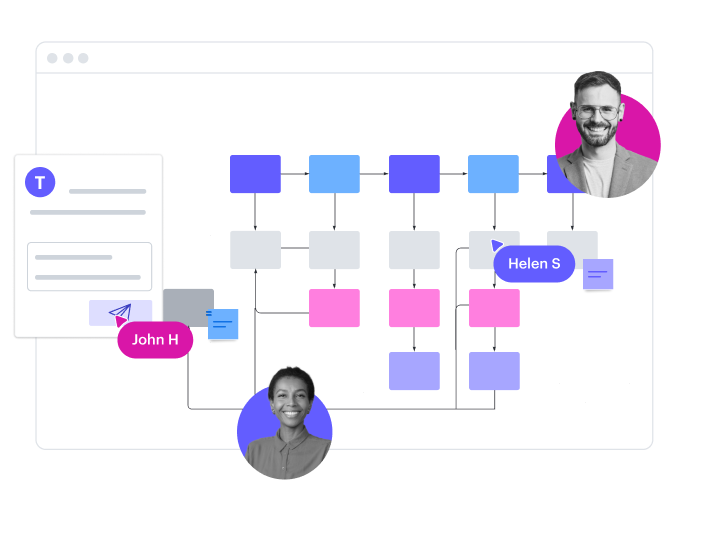
Design work order processes
Use custom shapes to visualize a flow for onboarding new employees. Improve your process with commenting and task assignments.
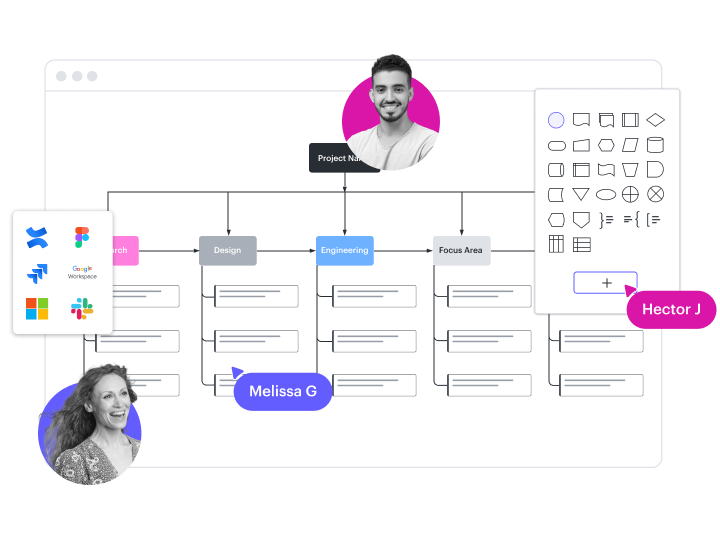
Create roadmaps
Work with cross-functional teams to prioritize projects and build timelines. Make planning seamless with Jira and Azure DevOps integrations.
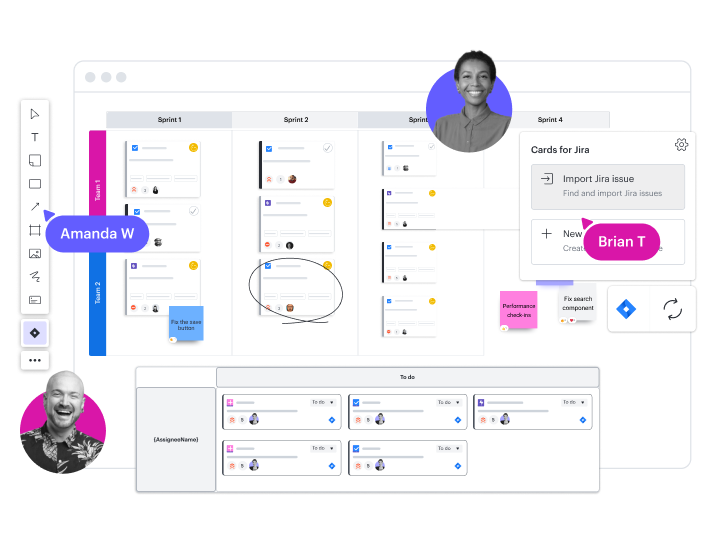
Streamline strategic planning
Use Visual Activities to rank priorities and reach consensus. Break down complex projects into manageable tasks with Lucid Cards.
Optimize your CI/CD pipeline
Visualize the deployable unit path for continuous integration and continuous delivery, so you can easily identify improvements.

Create documentation for security audits
Connect to your cloud provider—AWS, Azure, or Google Cloud—to automatically diagram your cloud infrastructure for annual security audits.
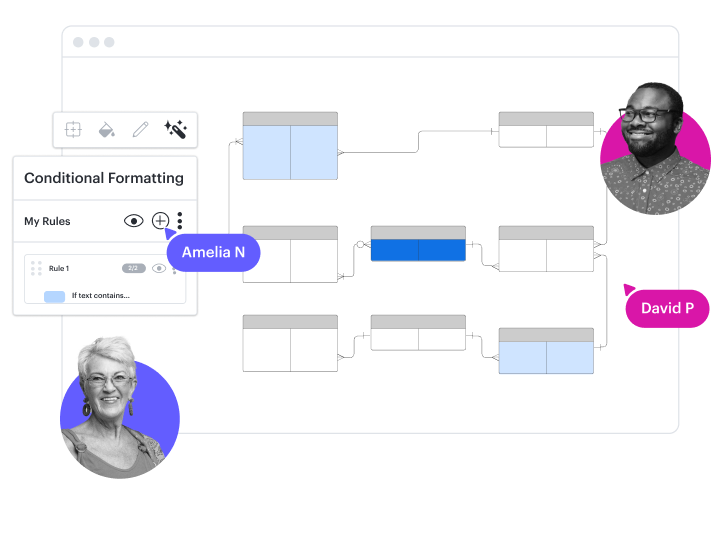
Visualize relationships between entities
Diagram and document the relationship between internal tools. Integrate with Confluence to embed diagrams into your knowledge base.
See more solutions
Explore use casesCloud Accelerator
Add the Cloud Accelerator to your Lucid Enterprise account to better understand and plan future changes to your cloud infrastructure.
Learn more
Popular integrations for IT teams
Connect Lucid with the apps you use most, and keep your teams and systems working together.


AWS
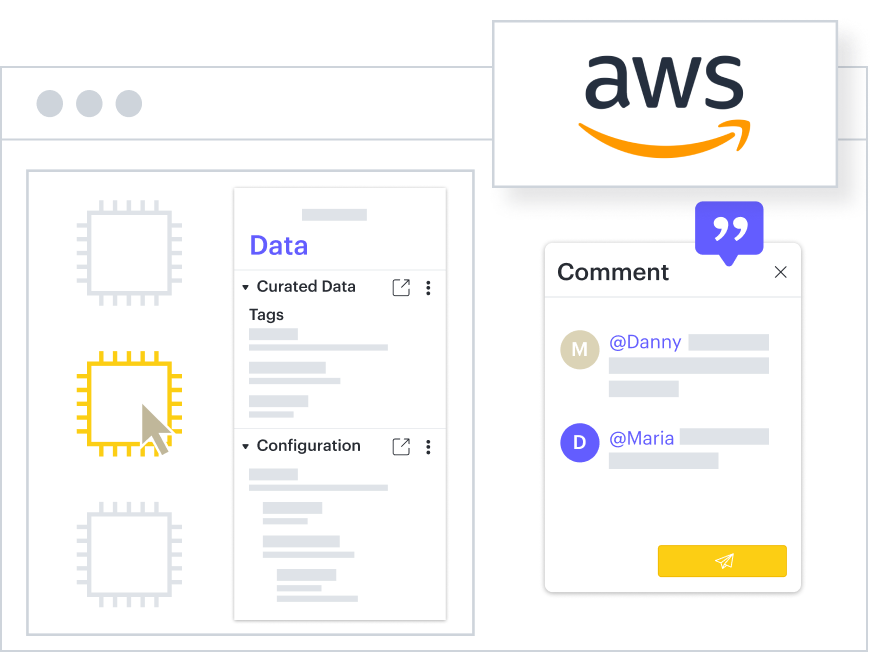
Automatically visualize multiple components of your AWS architecture. See your data in context, and customize views based on cloud data.
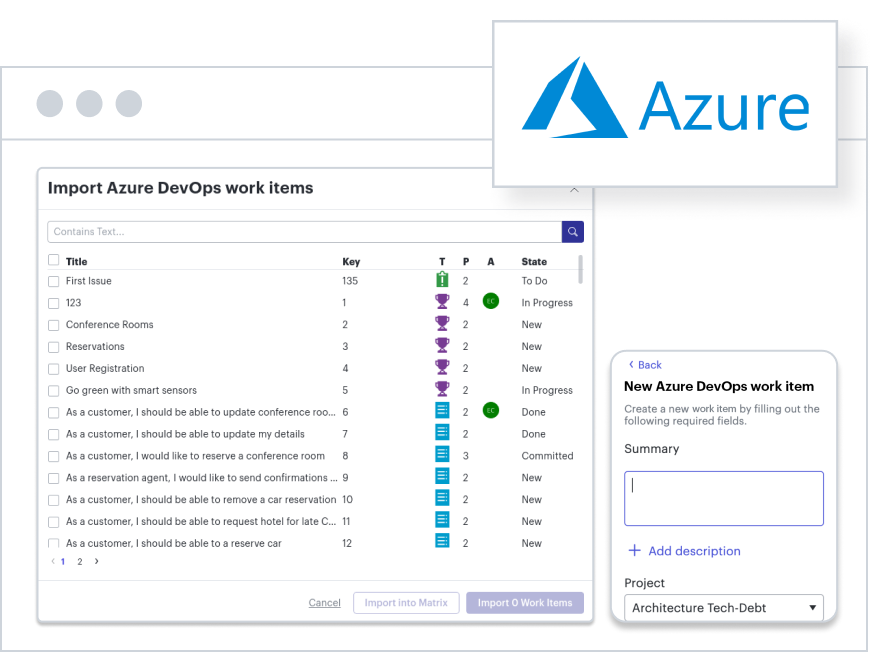
Azure
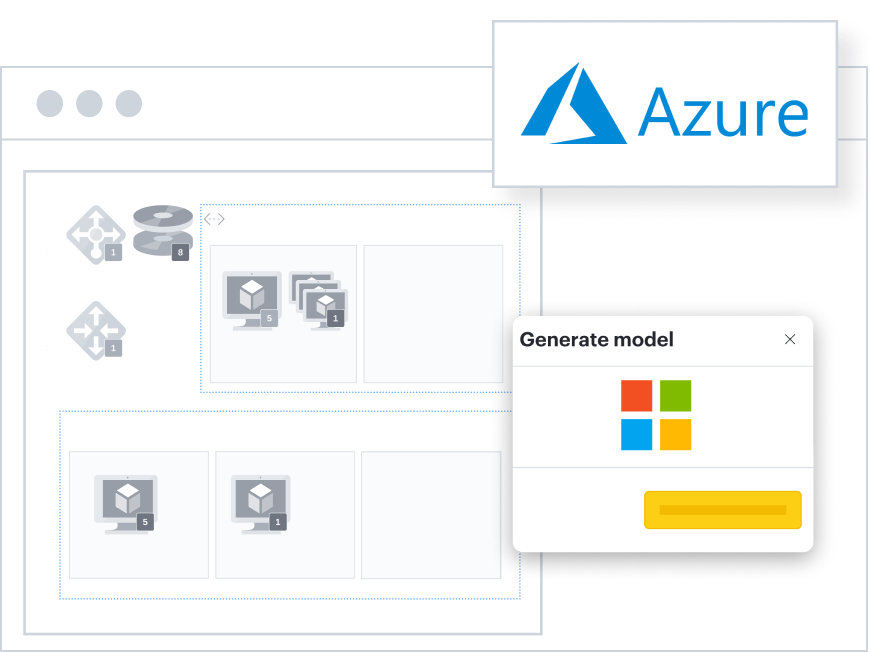
Import Azure cloud data to automatically create accurate, dynamic diagrams of your cloud environment. Visualize and leverage key data.
Google Cloud
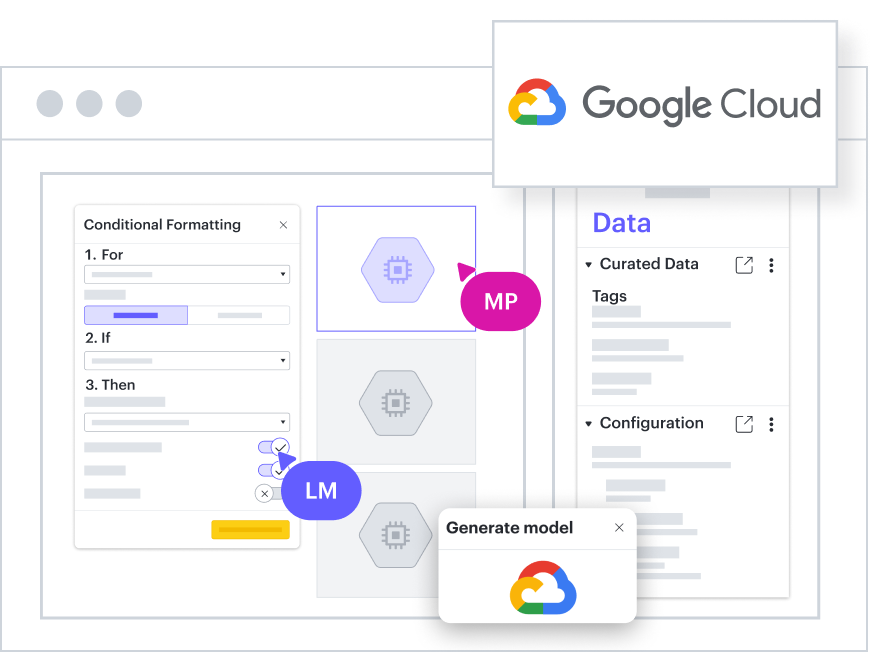
Better govern your cloud by importing data to auto-generate diagrams of your Google Cloud architecture. Focus on specific projects, instance groups, and more.
Lucid Cards for Azure DevOps
Import or create work items from Azure DevOps Cloud as Lucid Cards. Organize work items in Lucidspark and stay aligned with a bi-directional sync.
Lucid Cards for Jira
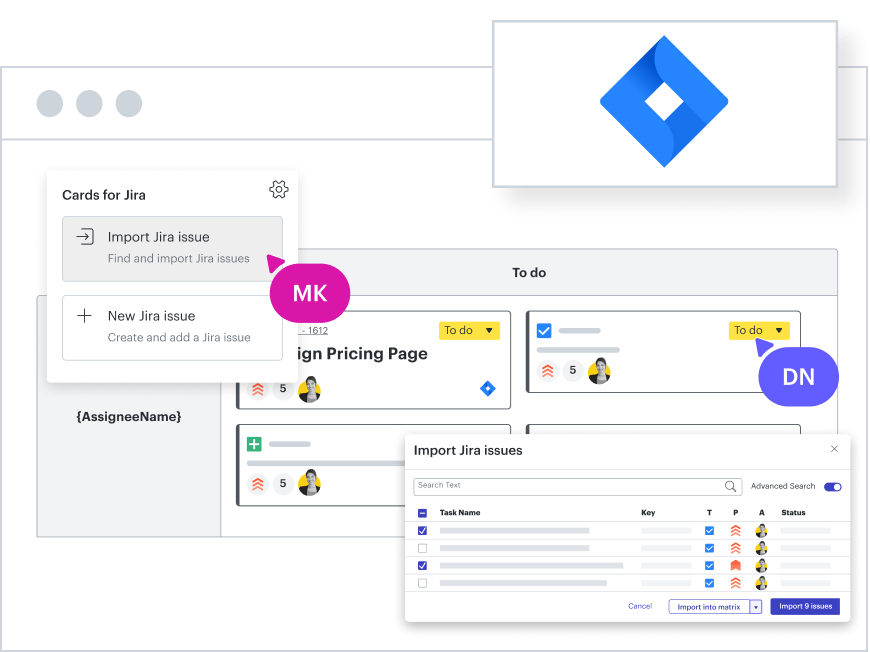
Import issues from Jira Cloud, Jira Data Center, or Jira Server into Lucidspark. Stay aligned with a bi-directional sync between Lucidspark and Jira.
Okta
Increase account security with domain control. Streamline single sign-on. Manage Lucidchart and Lucidspark licenses with auto-provisioning.
ServiceNow
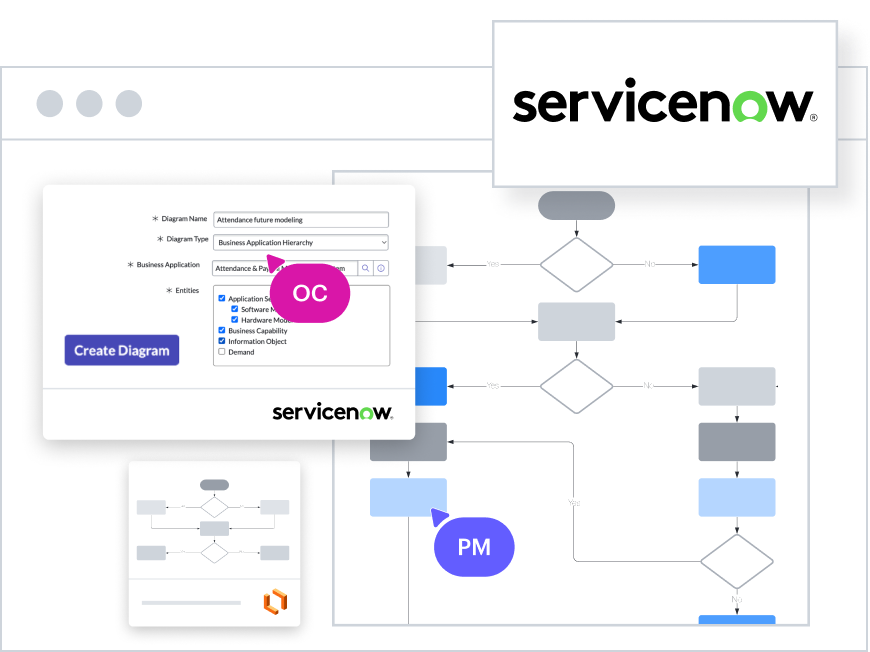
Automatically generate Lucidchart diagrams from your ServiceNow APM data. Easily access, customize, and share diagrams from within ServiceNow.
AWS
Automatically visualize multiple components of your AWS architecture. See your data in context, and customize views based on cloud data.
Azure
Import Azure cloud data to automatically create accurate, dynamic diagrams of your cloud environment. Visualize and leverage key data.
Google Cloud
Better govern your cloud by importing data to auto-generate diagrams of your Google Cloud architecture. Focus on specific projects, instance groups, and more.
Lucid Cards for Azure DevOps
Import or create work items from Azure DevOps Cloud as Lucid Cards. Organize work items in Lucidspark and stay aligned with a bi-directional sync.
Lucid Cards for Jira
Import issues from Jira Cloud, Jira Data Center, or Jira Server into Lucidspark. Stay aligned with a bi-directional sync between Lucidspark and Jira.
Okta
Increase account security with domain control. Streamline single sign-on. Manage Lucidchart and Lucidspark licenses with auto-provisioning.
ServiceNow
Automatically generate Lucidchart diagrams from your ServiceNow APM data. Easily access, customize, and share diagrams from within ServiceNow.
Additional resources
3 ways Lucid accelerates R&D innovation
Move your projects seamlessly from ideation to execution.
Lucid integrations marketplace
Explore industry-leading apps that integrate with Lucid.
Toolkit for effortless documentation
Document all your IT systems and processes with ease.
"We’re trying to make sure that the learnings of an individual consultant or the output of a successful project aren't just lost. In a consultancy, what tends to happen is you have a team of people that work really hard to deliver something during the course of a project, and at the end of that project they go on and move onto the next thing. The learnings and outputs are forgotten."
- Simon Evans, CTO at Ensono Digital
Go to case study“If there was an outage between any shift change, you could lose an hour or two while one team is sun setting and another team's coming up. That's basically a third of the day gone between shifting time zones and getting a new person up to speed. We use these diagrams to show what we've already done and what we have yet to figure out.”
- Toby Foss, Director of Cloud Network Operations at Informatica
Go to case study“When an agent receives a call from a customer, with a question or a complaint that something’s not working, we need to solve that problem as quickly as possible. Obviously, the more information we have about the customer and their location, the quicker we can solve that problem. So Lucidchart helps us provide agents with as much information as possible. It gives them a complete understanding of the local network.”
- Joshua Fruhman, Head of Deployment for the Application at Groupon
Go to case studyLucid for everyone
Give every team in your organization a better way to work—visually.
Engineering
See and understand the flow of ideas, systems, and processes. Make informed decisions faster to accelerate innovation.
Product and UX
Gather requirements, design mockups and user flows, and build roadmaps to communicate your product vision across teams.
Operations
Visualize every step of complex operational processes to drive informed decision-making and optimize efficiency.