Contents
Process mapping guide
9 min
This comprehensive process mapping guide offers everything you need to know about process maps including definitions, benefits, use cases, symbols, templates, best practices, and how to use Lucidchart to create a professional process map.
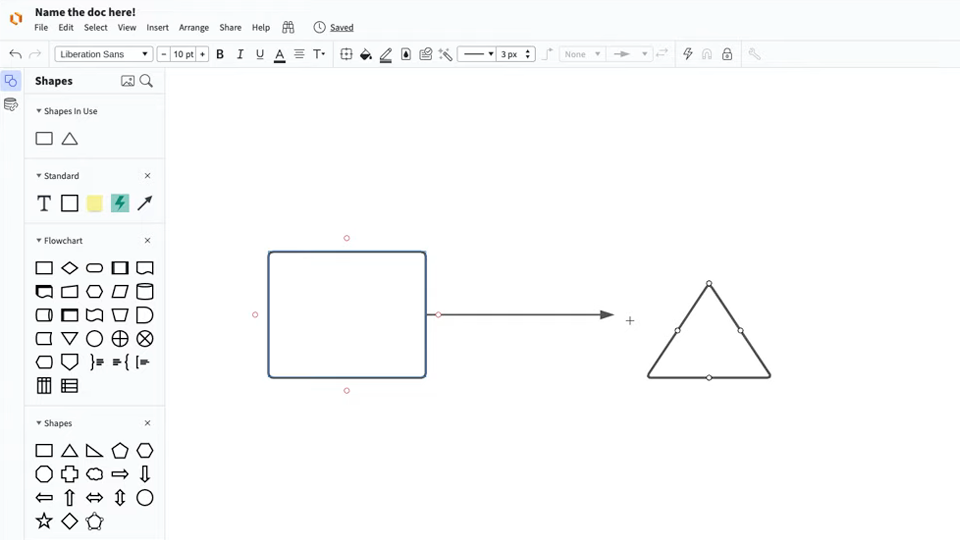
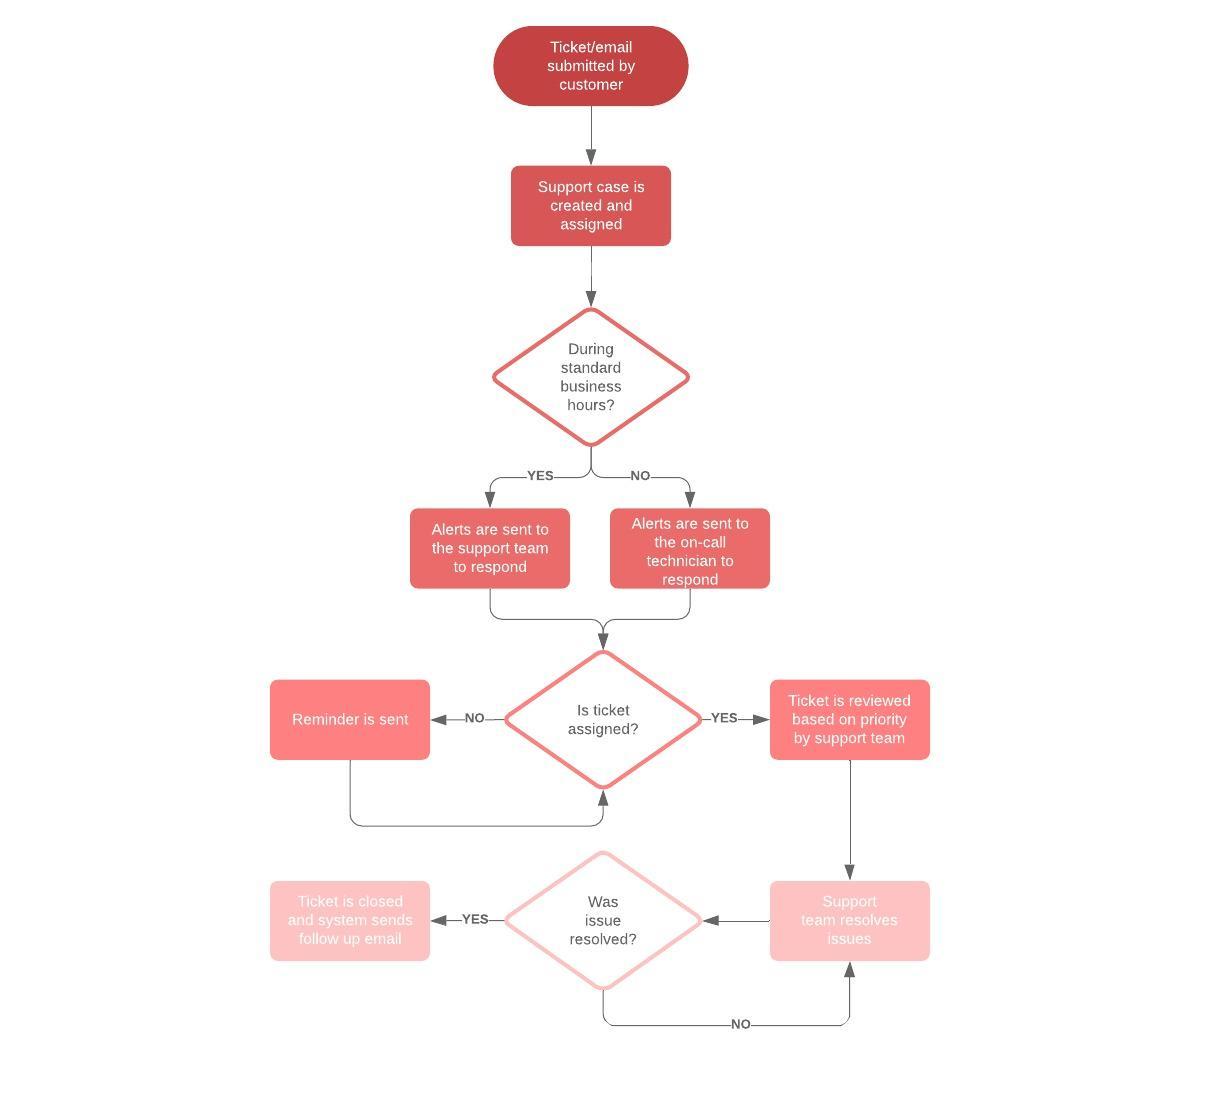
Process mapping tutorial
Process mapping templates
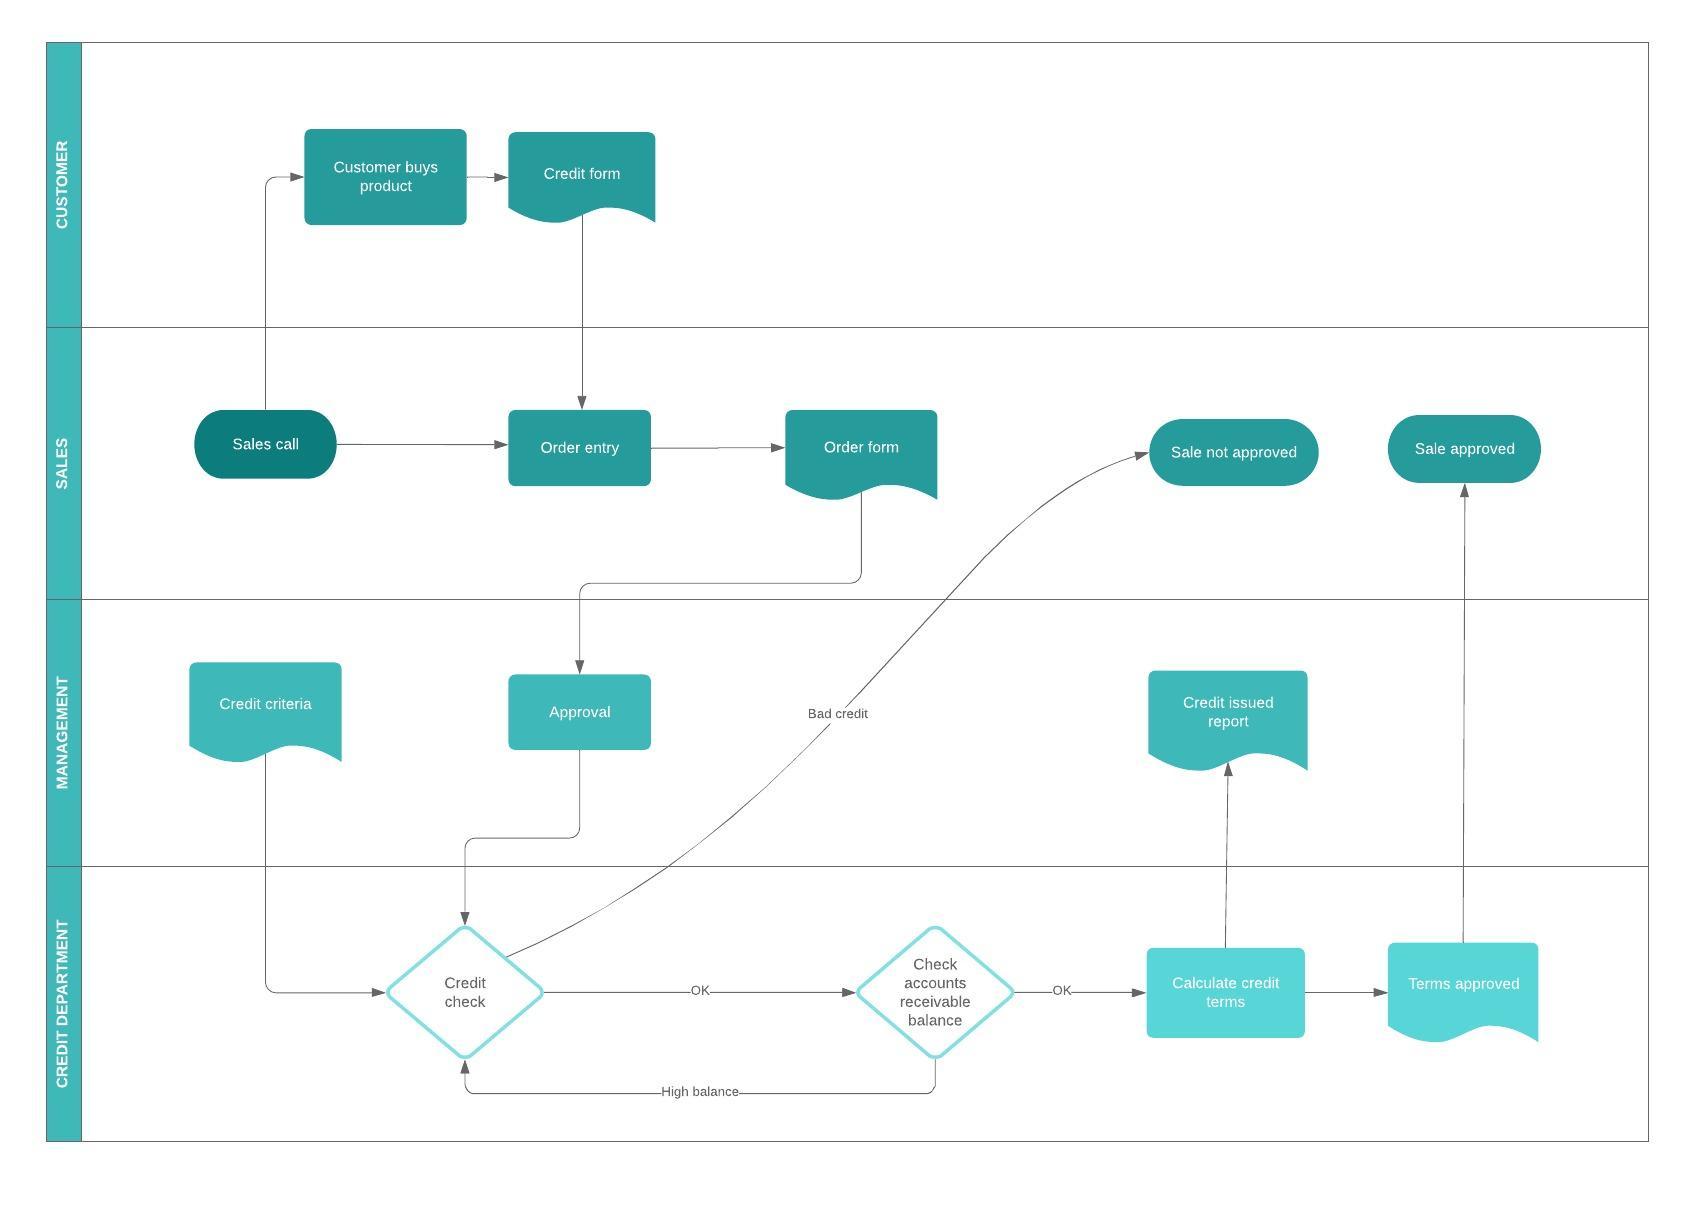
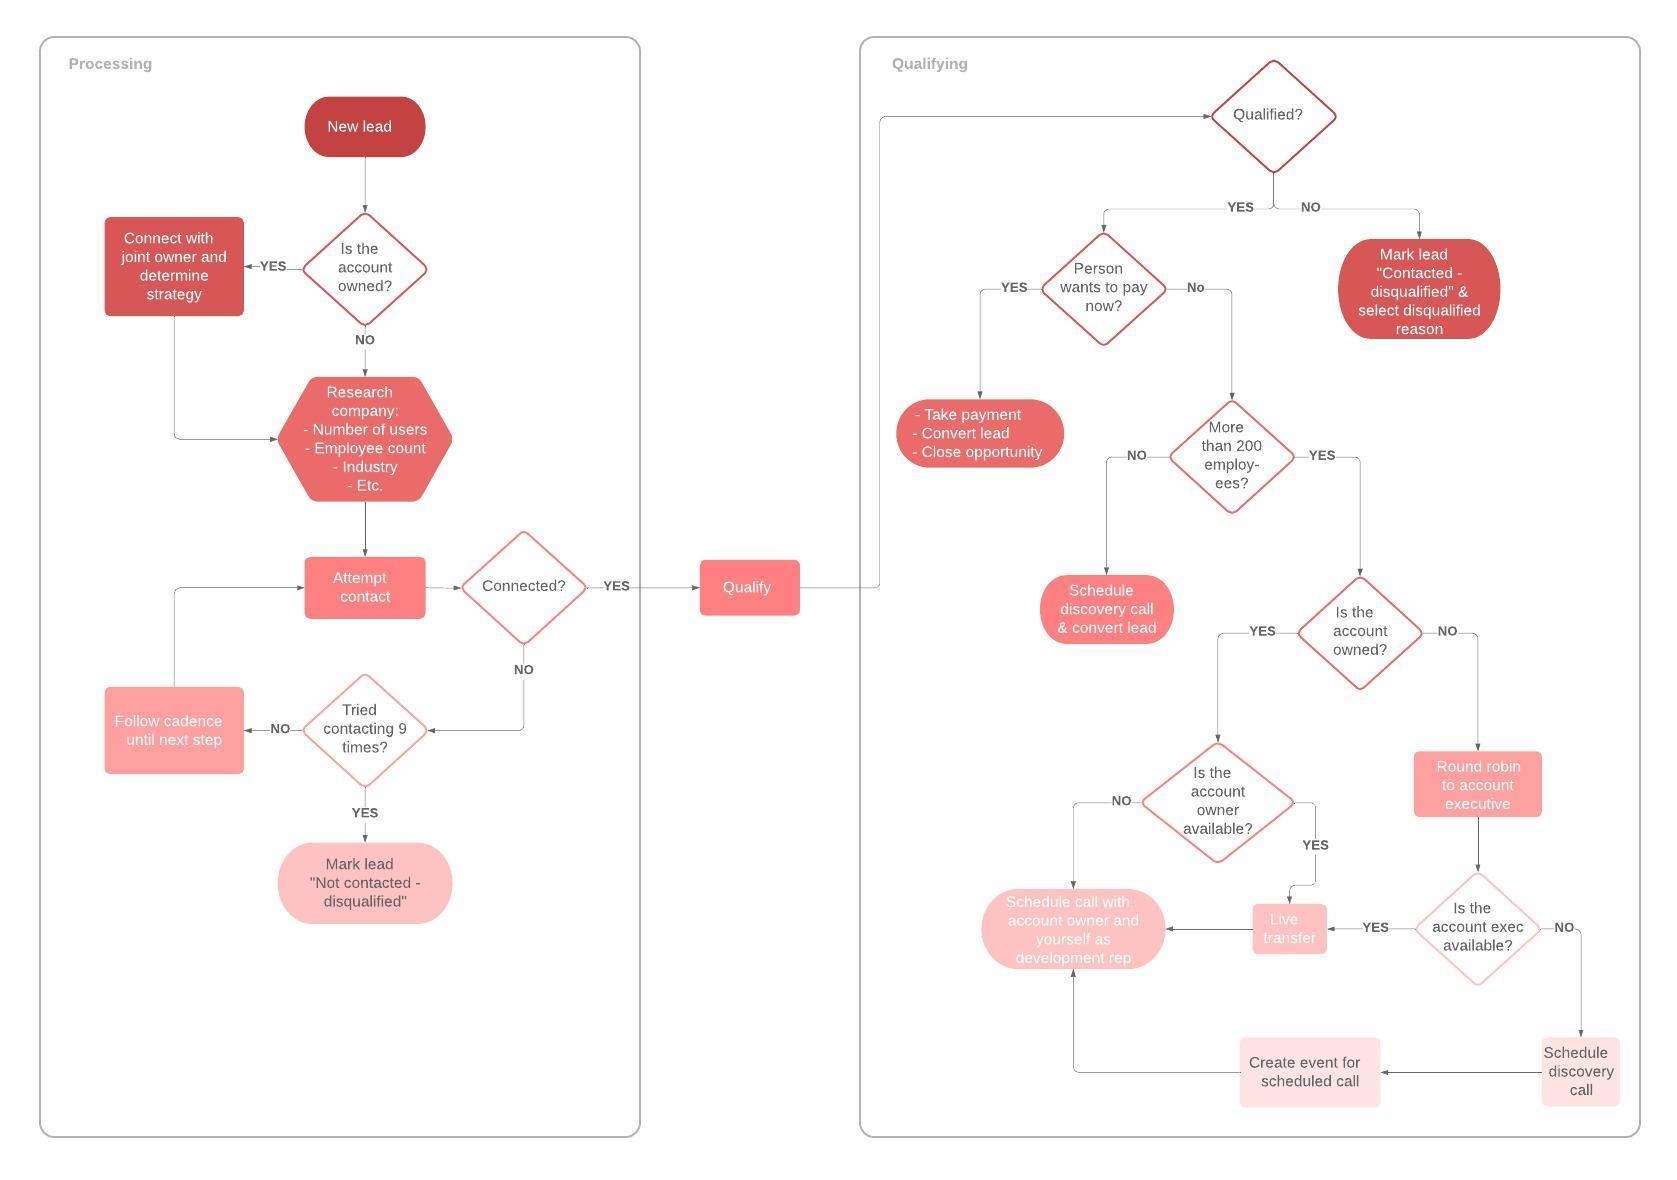
Processing and qualifying leads example
Pricing:
Paid Account
Processing and qualifying leads example, Pricing: Paid Account
Helpful resources
Process mapping software
Communicate complex processes with ease using Lucidchart's process mapping tools. Get started with a free account.
Process management software
Lucidchart is an intelligent diagramming solution that not only helps you visualize your current processes but also helps you manage their ongoing optimization.
Process map templates and examples
Start diagramming faster with templates for supply chain, business, project management, sales, and IT processes.
Course: Process improvement guide
With this self-paced course, learn how to improve your processes, remove impediments, and make work easier for your teams using Lucid.
Course: Process diagrams in Lucidchart
Part of the Lucidchart Fundamentals pathway, this course will walk you through the process of visualizing and improving team workflows.
Process mapping FAQs
What is a process map?
What are the basic symbols used in process mapping?
What are the main steps to create a process map?
What are the benefits of process mapping?
What is a swimlane process map?
What is the difference between a high-level process map and a detailed process map?
Can I create a process map in Lucidchart from a spreadsheet?
What is a value stream map?
Everything you need to make a diagram
In addition to our online diagram maker, Lucidchart offers support and training resources to help you branch out to any type of diagram.
View training labs