This comprehensive process mapping guide offers everything you need to know about process maps including definitions, benefits, use cases, symbols, templates, best practices, and how to use Lucidchart to create a professional process map.
What is a process map
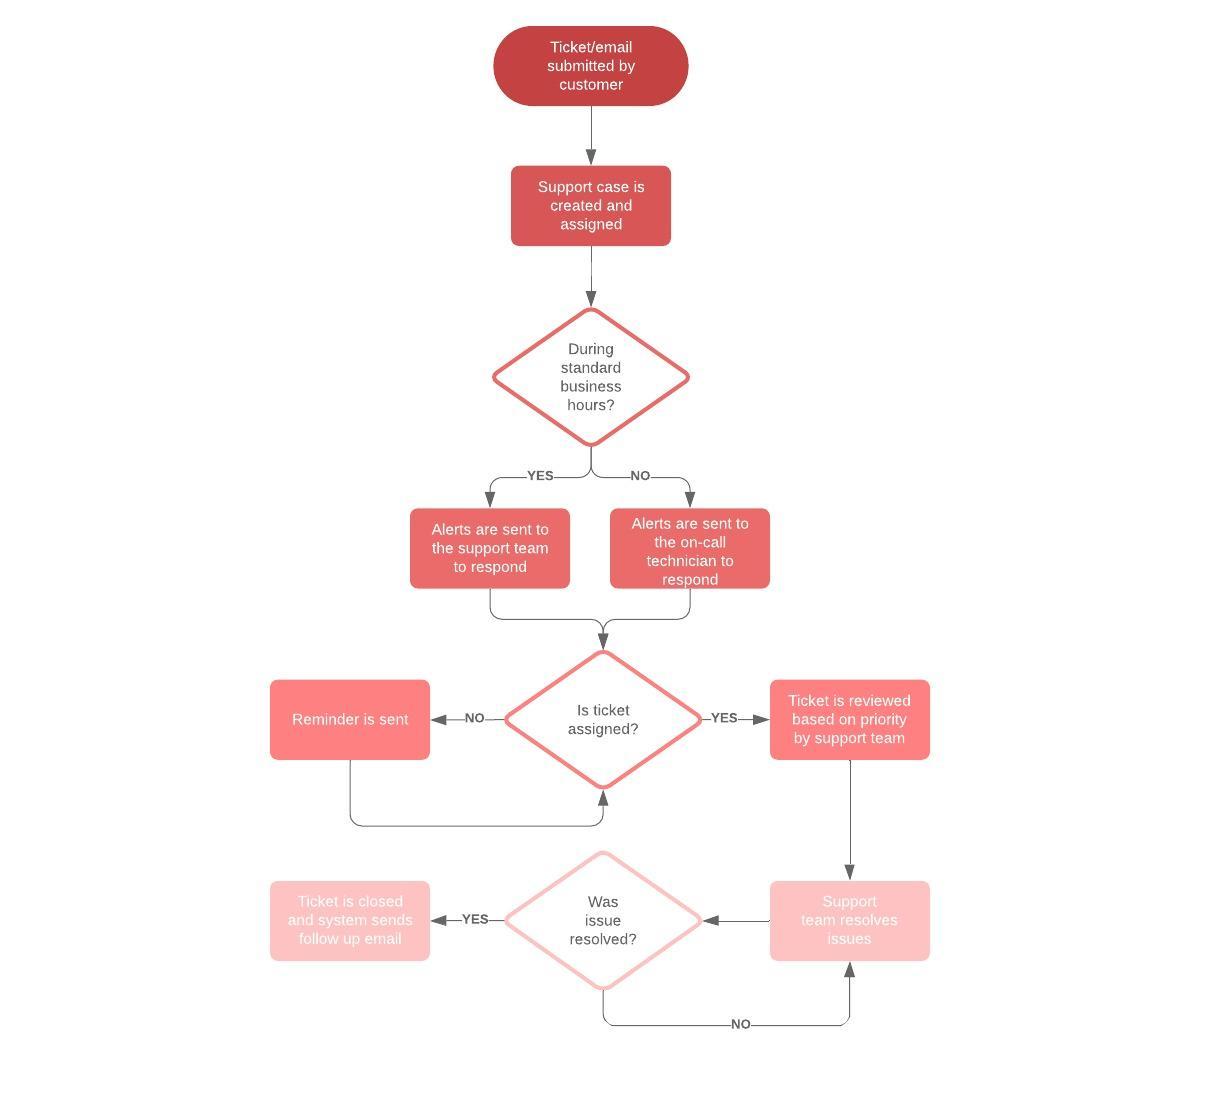
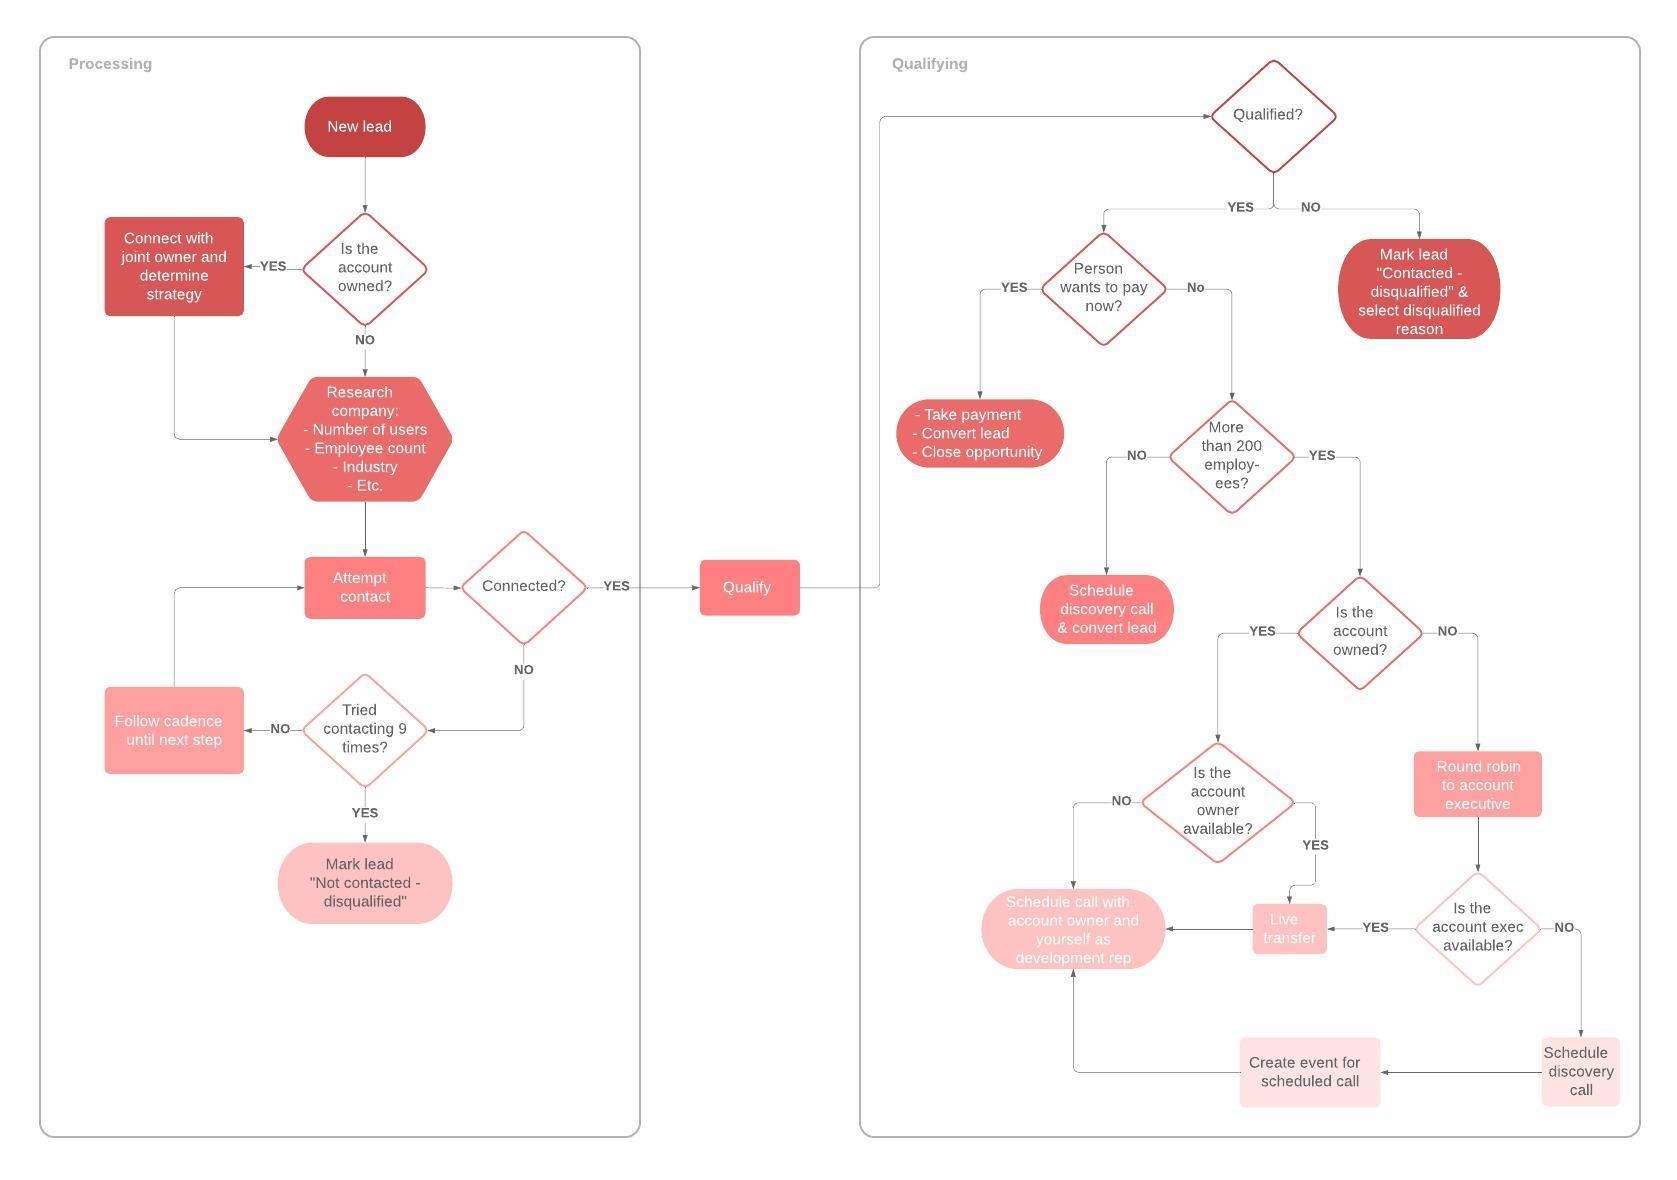
A process map is a planning and management tool that visually describes the flow of work and show a series of events that produce an end result. A process map is also called a flowchart, process flowchart, process chart, functional process chart, functional flowchart, process model, workflow diagram, business flow diagram or process flow diagram. It shows who and what is involved in a process and can be used in any business or organization and can reveal areas where a process should be improved.
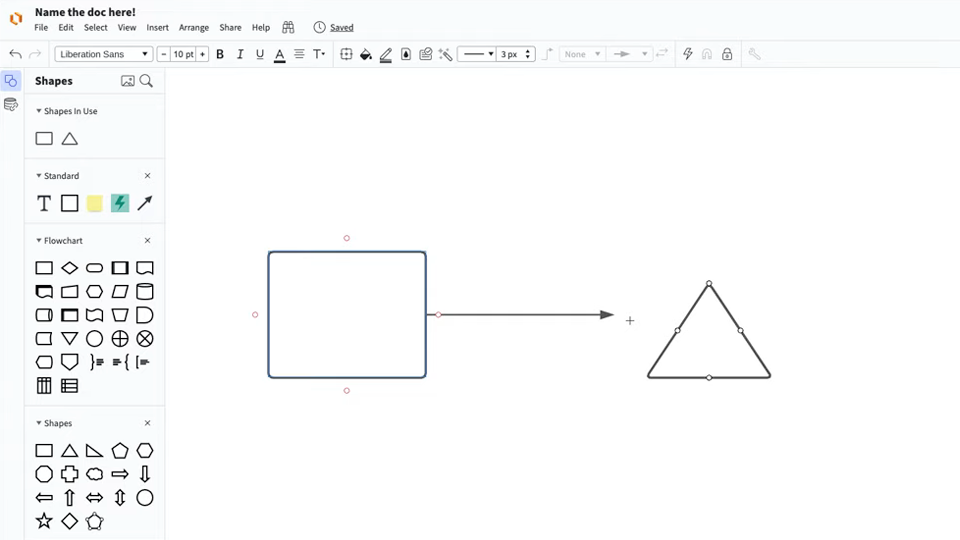
Master the basics of Lucidchart in 3 minutes
- Create your first diagram from a template or blank canvas or import a document.
- Add text, shapes, and lines to customize your diagram.
- Learn how to adjust styling and formatting.
- Locate what you need with Feature Find.
- Share your diagram with your team to start collaborating.
Master the basics of Lucidchart in 3 minutes
Process mapping symbols
Many of these process mapping symbols are best used only in very specific technical situations where all participants understand the symbols being used. For regular process mapping, basic flowchart shapes like process and operations symbols are a perfect choice. It’s also a good idea to include a symbol key and use best practices when creating a flowchart.
Process and operation symbols
| Symbol | Name | Description |
|---|---|---|

| Process |
The most frequently used flowchart shape shows an action, task or operation that needs to be done. |

| Subroutine |
Shows a series of actions related to a task, which itself is part of a larger process. It could also mean that there is already a flowchart for the larger process that can be used as a reference. |

| Alternate Process | An alternative to the regular process step. Lines connecting with the alternate process symbol are usually dashed. |

| Delay | Represents a waiting period or delay in the process. |

| Preparation | A preparatory step that sets up another step in the process. |

| Manual Loop | A sequence of commands that continually repeats until stopped manually. |

| Loop Limit | The point at which a loop stops. |
Branching and control of flow symbols
| Symbol | Name | Description |
|---|---|---|

| Arrow | The arrows indicate the direction in which the flowchart should be read (usually from the top to the bottom and/or the left to the right). |

| Terminator | Represents the entry and exit points of your flowchart. Usually a flowchart has only one starting point but can have several ending points. |

| Decision | The point at which a decision needs to be made. The arrows flowing from the decision shape are usually labeled with yes, no, true or false. |

| Connector | In order to connect to different page or section of the chart, and you can't draw a line, you can use a circle labeled with a letter. Put another circle with the same letter where the flow continues. |

| Off-page Connector |
Indicates the process continues off page. A letter or page number in the shape tells you where to go. |

| Merge | A step where two or more sub-processes merge together and become one. |

| Extract | Shows when a process divides into different but parallel directions. |

| Or | Represents when a process diverges, usually for more than two branches. |

| Summoning or Junction | When multiple sub-processes merge into a single process. |
Input and output symbols
| Symbol | Name | Description |
|---|---|---|

| Input/Output or Data | Represents material or information entering or leaving the process. Receiving a report is an input. Generating a report is an output. |

| Document | Indicates a process step that generates a document or report. |

| Multiple Documents | A process step that produces multiple documents or reports. |

| Display | A step that displays information to a person. |

| Manual Input | Represents a step where a user must input information manually. |
File and information storage symbols
| Symbol | Name | Description |
|---|---|---|

| Stored Data Symbol | Represents a step in the process where data gets stored. |

| Database Symbol | A list of information with a standard structure that allows for searching and sorting. |

| Direct Access Storage Symbol | Represents a hard drive. |

| Internal Storage Symbol | Used in programming to represent information stored in memory instead of on a file. |
Data processing symbols
| Symbol | Name | Description |

| Collate Symbol | Represents a process that organizes data or materials into a standard format. |

| Sort Symbol | Indicates the sorting of data, information, and materials into a pre-determined order. |
Types of process maps
Process mapping is about communicating your process to others. You can build stronger understanding with process maps. The most common process map types include:
- Activity Process Map - Represents value added and non-value added activities in a process.
- Detailed Process Map - Provides a much more detailed look at each step in the process.
- Document Map - documents are the inputs and outputs in a process.
- High-Level Process Map - High-level representation of a process involving interactions between Supplier, Input, Process, Output and Customer. Also called a SIPOC diagram.
- Rendered Process Map - Represents current state and/or future state processes to show areas for process improvement.
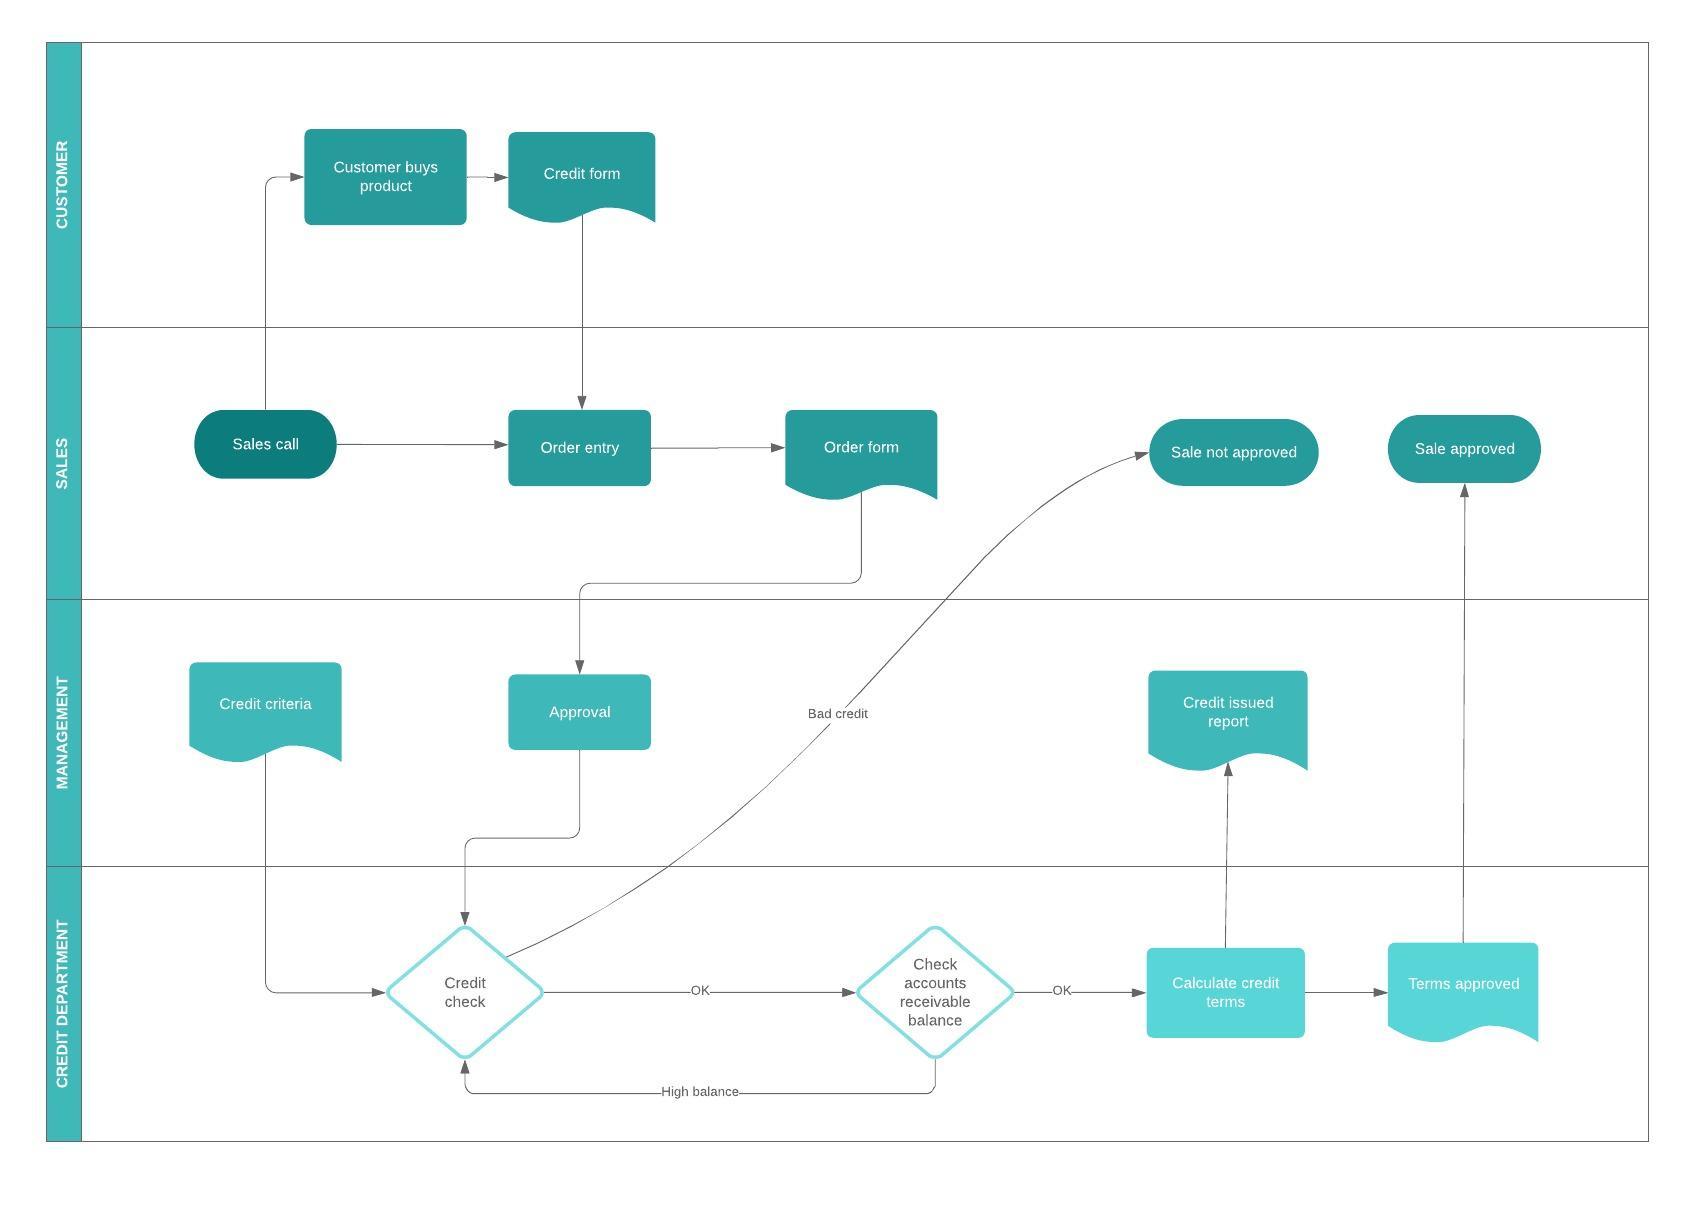
- Swimlane (or Cross-functional) Map - Separates out the sub-process responsibilities in the process between team members or departments.
- Value-Added Chain Diagram - Unconnected boxes that represent a very simplified version of a process for quick understanding
- Value Stream Map - a lean-management technique that analyzes and improves processes needed to make a product or provide a service to a customer.
- Work Flow Diagram - a work process shown in “flow” format that doesn’t utilize Unified Modeling Language (UML) symbols.
Purpose of process mapping
The purpose of process mapping is for organizations and businesses to improve efficiency. Process maps provide insight into a process, help teams brainstorm ideas for process improvement, increase communication and provide process documentation. Process mapping will identify bottlenecks, repetition and delays. They help to define process boundaries, process ownership, process responsibilities and effectiveness measures or process metrics.
- Increase understanding of a process
- Analyze how a process could be improved
- Show others how a process is done
- Improve communication between individuals engaged in the same process
- Provide process documentation
- Plan projects
Benefits of process mapping
Process mapping spotlights waste, streamlines work processes and builds understanding. Process mapping allows you to visually communicate the important details of a process rather than writing extensive directions.
- Create and speed up the project design
- Provide effective visual communication of ideas, information and data
- Help with problem solving and decision making
- Identify problems and possible solutions
- Can be built quickly and economically
- Show processes broken down into steps and use symbols that are easy to follow
- Show detailed connections and sequences
- Show an entire process from the beginning to the end
Process maps help you to understand the important characteristics of a process, allowing you to produce helpful data to use in problem solving. Process maps let you strategically ask important questions that help you improve any process.
Process mapping tutorial
Process mapping tutorial in Lucidchart
How to make a process map
- Step 1: Identify the problem:
- What is the process that needs to be visualized? Type its title at the top of the document.
- Step 2: Brainstorm all the activities that will be involved:
- At this point, sequencing the steps isn’t important, but it may help you to remember the steps needed for your process. Decide what level of detail to include. Determine who does what and when it is done.
- Step 3: Figure out boundaries:
- Where or when does the process start?
- Where or when does the process stop?
- Step 4: Determine and sequence the steps:
- It’s helpful to have a verb begin the description. You can show either the general flow or every detailed action or decision.
- Step 5: Draw basic flowchart symbols:
- Each element in a process map is represented by a specific flowchart symbol, which together represent process mapping symbols:
- Ovals show the beginning or the ending of a process.
- Rectangles show an operation or activity that needs to be done.
- Arrows represent the direction of flow.
- Diamonds show a point where a decision must be made. Arrows coming out of a diamond are usually labeled yes or no. Only one arrow comes out of an activity box. If more than is needed, you should probably use a decision diamond.
- Parallelograms show inputs or outputs
- Each element in a process map is represented by a specific flowchart symbol, which together represent process mapping symbols:
- Step 6: Finalize the process flowchart
- Review the flowchart with other stakeholders (team member, workers, supervisors, suppliers, customers, etc.) to make sure everyone is in agreement.
- Make sure you’ve included important chart information like a title and date, which will make it easy to reference.
- Helpful questions to ask:
- Is the process being run how it should?
- Will team members follow the charted process?
- Is everyone in agreement with the process map flow?
- Is anything redundant?
- Are any steps missing?
Everything you need to make a diagram
Make a polished, professional diagram for free with Lucidchart. No matter what you have in mind, we have the tools you need to build it. Make an account and start diagramming today.
Sign up free