The Unified Modeling Language (UML) is the standard language that many software engineers and business professionals use to create a broad overview of complex systems. A deployment diagram is one type of diagram created with this language. Along with our UML diagramming tool, use this guide to learn more about deployment diagrams. If you’re ready to build one yourself, this tutorial also includes practical steps for drawing, formatting, and sharing a finished deployment diagram in Lucidchart.
What is a deployment diagram?
In the context of the Unified Modeling Language (UML), a deployment diagram falls under the structural diagramming family because it describes an aspect of the system itself. In this case, the deployment diagram describes the physical deployment of information generated by the software program on hardware components. The information that the software generates is called an artifact. This shouldn't be confused with the use of the term in other modeling approaches like BPMN.
Deployment diagrams are made up of several UML shapes. The three-dimensional boxes, known as nodes, represent the basic software or hardware elements, or nodes, in the system. Lines from node to node indicate relationships, and the smaller shapes contained within the boxes represent the software artifacts that are deployed. Since they can describe hardware, deployment diagrams are unique in the UML world.
Deployment diagram applications
Deployment diagrams have several valuable applications. You can use them to:
- Show which software elements are deployed by which hardware elements.
- Illustrate the runtime processing for hardware.
- Provide a view of the hardware system's topology.
Deployment diagram guidelines
Use Lucidchart's UML diagram tool to construct deployment diagrams. Before you begin diagramming, ask yourself these questions:
- Have you identified the scope of your system? For example, you should know whether you are diagramming a single application or the deployment to a whole network of computers.
- What are the limitations of your physical hardware? What legacy systems will you need to interact with? Make sure that you know the operating software and protocols you will be working with and what monitoring you will be putting into place.
- Which distribution architecture are you using? You should know how many tiers your application will have and which application you will deploy to.
- Do you have all the nodes you need? Do you know how they are all connected?
- Do you know which components are going to be on which nodes?
Once you’ve answered these questions, it can help to draft a simple inventory of the nodes you plan to show and how they relate, then translate that list into UML notation.
Deployment diagram elements
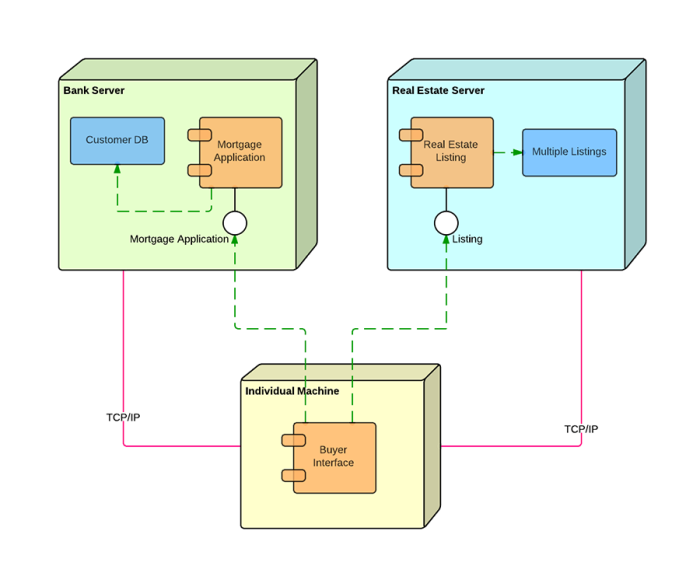
A variety of shapes make up deployment diagrams. This list offers an overview of the basic elements you may encounter, and you can see most of these items illustrated in the image below.
- Artifact: A product developed by the software, symbolized by a rectangle with the name and the word "artifact" enclosed by double arrows.
- Association: A line that indicates a message or other type of communication between nodes.
- Component: A rectangle with two tabs that indicates a software element.
- Dependency: A dashed line that ends in an arrow, which indicates that one node or component is dependent on another.
- Interface: A circle that indicates a contractual relationship. Those objects that realize the interface must complete some sort of obligation.
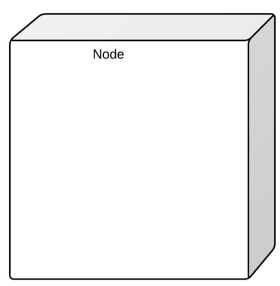
- Node: A hardware or software object, shown by a three-dimensional box.
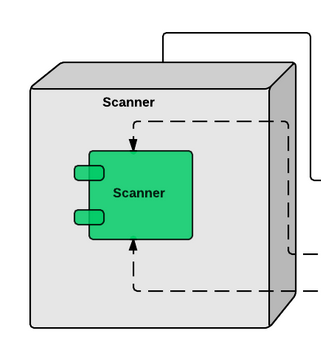
- Node as container: A node that contains another node inside of it—such as in the example below, where the nodes contain components.
- Stereotype: A device contained within the node, presented at the top of the node, with the name bracketed by double arrows.
In practice, you’ll often decide on the diagram’s purpose first (for example, topology vs. runtime processing), then choose which of these elements you need to express that purpose clearly.
Deployment diagram symbols and notation
Use these shapes as you build UML deployment diagrams.
Nodes
There are two types of nodes in a deployment diagram: device nodes and execution environment nodes. Device nodes are computing resources with processing capabilities and the ability to execute programs. Some examples of device nodes include PCs, laptops, and mobile phones.
An execution environment node, or EEN, is any computer system that resides within a device node. It could be an operating system, a JVM, or another servlet container.
Database
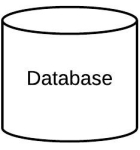
Databases represent any data stored by the deployed system. In some instances, you'll see a database represented as just another node, but sometimes you will see this shape as a database.
Other shapes
- Communication path: A straight line that represents communication between two device nodes.
- Artifacts: A box with the header "<>" and then the name of the file.
- Package: A file-shaped box that groups together all the device nodes to encapsulate the entire deployment.
- Component: An entity required to execute a stereotype function.
When you’re placing these symbols, remember that deployment diagrams can range from simple to highly detailed; for instance, you may show one node nested inside another to reflect a particular deployment pattern.
Deployment diagram example
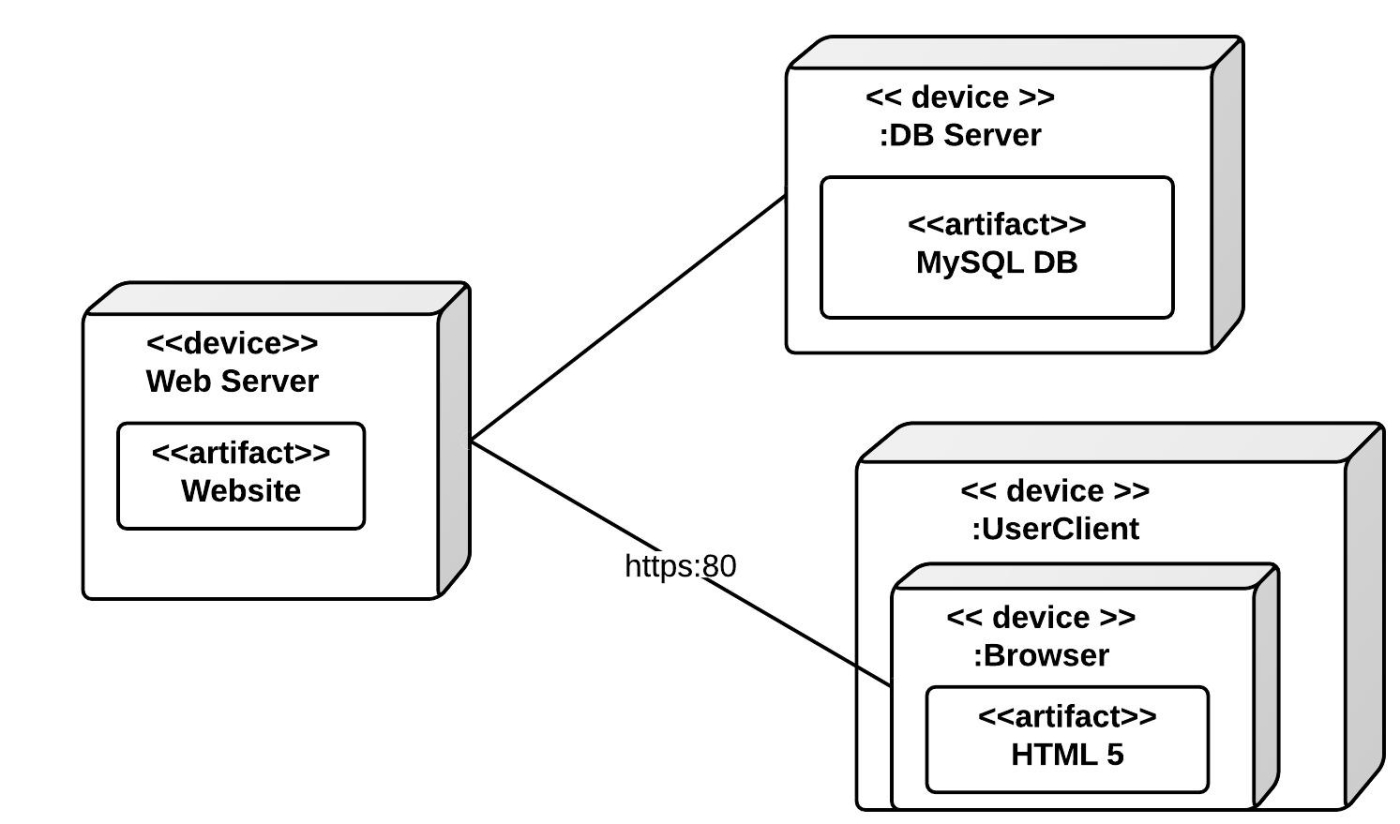
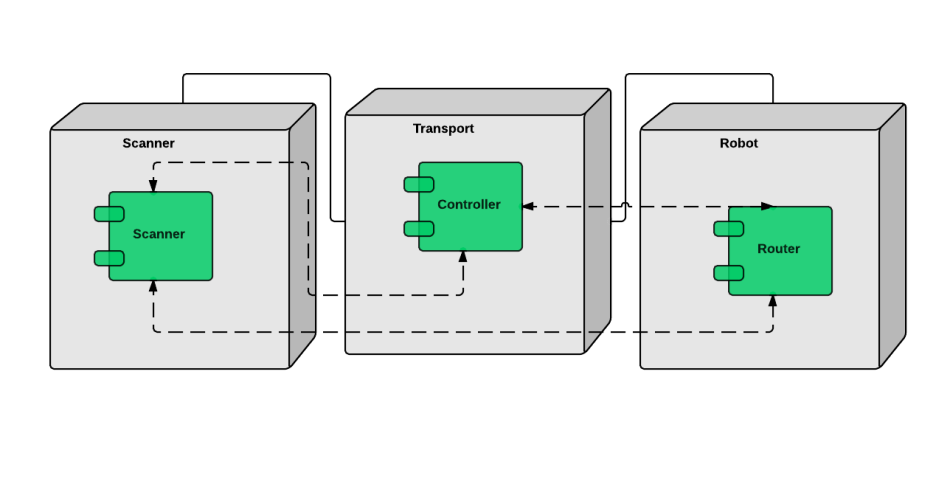
This example shows a basic deployment diagram for Lucidchart. There is a web server, a database server, and the machine where the user views the website. You can add more complexity by showing the different parts of the web server and the way Javascript works on the UserClient, but this example gives you an idea of how a deployment looks in UML notation.
How to draw a deployment diagram in Lucidchart
After you understand the core notation, the next step is turning your model into a clean, shareable diagram. The workflow below follows a practical sequence: set up your canvas, identify what you need to show, add and connect shapes, then publish or download the result.
1. Get started with Lucidchart
The first step to creating an incredible UML diagram is to sign up for Lucidchart. Lucidchart offers an intuitive interface, premade templates, and extensive shape libraries, so creating complex deployment diagrams won't be an issue.
Once you have logged into Lucidchart, create a new blank document and enable the UML shape libraries. Click on Shapes in the upper-left corner of your screen and check "UML" in the menu that appears. Now all of Lucidchart's UML shapes will be available to the left of the canvas.
2. Identify components
Start by clarifying what you want the diagram to communicate, then list the nodes and the software elements that will be deployed to them. Deployment diagrams can serve several purposes, all of which relate to hardware. Some of these functions include:
-
Capturing runtime processing for hardware elements
-
Illustrating the general topology for a given hardware system
-
Demonstrating how certain software components are deployed by specific hardware components
Once you've identified the purpose of your deployment diagram, you will need to determine the elements within. The principal elements of any deployment diagram are nodes. These large 3D boxes symbolize the elements that deploy objects. The objects contained in boxes—such as stereotypes, artifacts, and components (a component is illustrated in the example below)—are the objects that are being deployed.
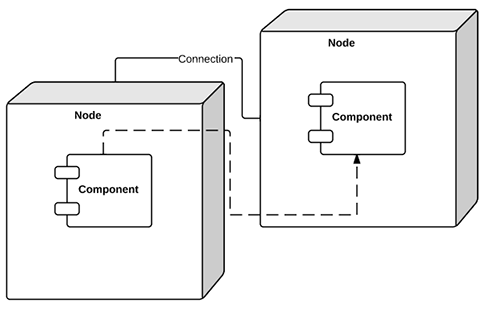
Lines from node to node indicate either relationships between nodes or relationships between the messages they send out. Note that deployment diagrams can achieve a high level of complexity—for example, depending on the pattern of deployment you are trying to express, you might have one node contained in another node. It may be helpful to start with a list that clearly denotes the nodes you wish to display and their interrelationships.
3. Add shapes
Turn on the UML shape libraries to begin drawing your diagram in Lucidchart. Within the UML deployment shape library, drag out your first symbol: a node. Label it and choose which shapes should be contained within the node. You could add an artifact, a component, an instance, or a basic object. You can easily add, delete, or swap out elements in the node. To relabel any element with a different name, simply click and type.
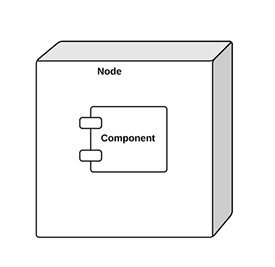
After adding your first node, add and label more nodes until you have completed the structure of your diagram. Then add the component shapes that will be deployed into the node boxes.
4. Connect nodes
After that, you're ready to connect the two nodes. To add a line, drag your mouse from the red circle that appears when you hover over the shape and connect it to the appropriate shape.
5. Format arrows
When you draw relationships between elements inside the nodes, you will likely need to illustrate more complex connections. The Lucidchart editor allows you to change the style and arrows on each line to show a unique type of relationship. Just use the properties bar above the canvas.
6. Complete your diagram
Add lines and nodes until you have finished describing the system. Feel free to add different colors to your diagram to make the content more accessible.
7. Publish, implement, and share
Congratulations! You have now completed your deployment diagram. After you finish, you can publish and share your deployment diagram with the team to use as a quick reference or to speed up the onboarding process.
To share your document with collaborators, either Lucidchart users or non-users, click the orange Share button in the top-right corner of your screen. From this same menu, you can easily post your diagram to social media.
To download your diagram, click on File > Download As and choose the file type that you want. By downloading your document, you can circulate the diagram without worrying that others will make unauthorized changes. Publishing and sharing your diagrams is incredibly easy with Lucidchart.
After you review this page, you can draw your own deployment diagram with Lucidchart, a free visual communication platform that produces sleek, seamless diagrams.
Ready to create your own UML diagram? Try Lucidchart. It's fast, easy, and free to get started.
Everything you need to make a diagram
Make a polished, professional diagram for free with Lucidchart. No matter what you have in mind, we have the tools you need to build it. Make an account and start diagramming today.
Sign up free