A state diagram, sometimes known as a state machine diagram, is a type of behavioral diagram in the Unified Modeling Language (UML) that shows transitions between various objects. Using our collaborative UML diagram software, build your own state machine diagram with a free Lucidchart account today!
What is a state diagram in UML?
A state machine is any device that stores the status of an object at a given time and can change status or cause other actions based on the input it receives. States refer to the different combinations of information that an object can hold, not how the object behaves. In order to understand the different states of an object, you might want to visualize all of the possible states and show how an object gets to each state, and you can do so with a UML state diagram.
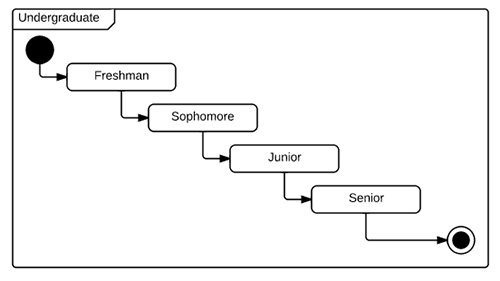
Each state diagram typically begins with a dark circle that indicates the initial state and ends with a bordered circle that denotes the final state. However, despite having clear start and end points, state diagrams are not necessarily the best tool for capturing an overall progression of events. Rather, they illustrate specific kinds of behavior—in particular, shifts from one state to another.
State diagrams mainly depict states and transitions. States are represented with rectangles with rounded corners that are labeled with the name of the state. Transitions are marked with arrows that flow from one state to another, showing how the states change. Below, you can see both these elements at work in a basic diagram for student life. Our UML diagram tool, opens in a new tab can help you design any custom state machine diagram.
And with our diagram as code feature, it’s faster and easier than ever. You can create a custom mockup of a state machine diagram and add it to your Lucidchart document using Mermaid coding.
State diagram applications
Like most UML diagrams, state diagrams have several uses. The main applications are as follows:
- Depicting event-driven objects in a reactive system.
- Illustrating use case scenarios in a business context.
- Describing how an object moves through various states within its lifetime.
- Showing the overall behavior of a state machine or the behavior of a related set of state machines.
State diagram symbols and components
You can include many different shapes in a state diagram, particularly if you choose to combine it with another diagram. This list summarizes the most common shapes you may encounter.
Composite state
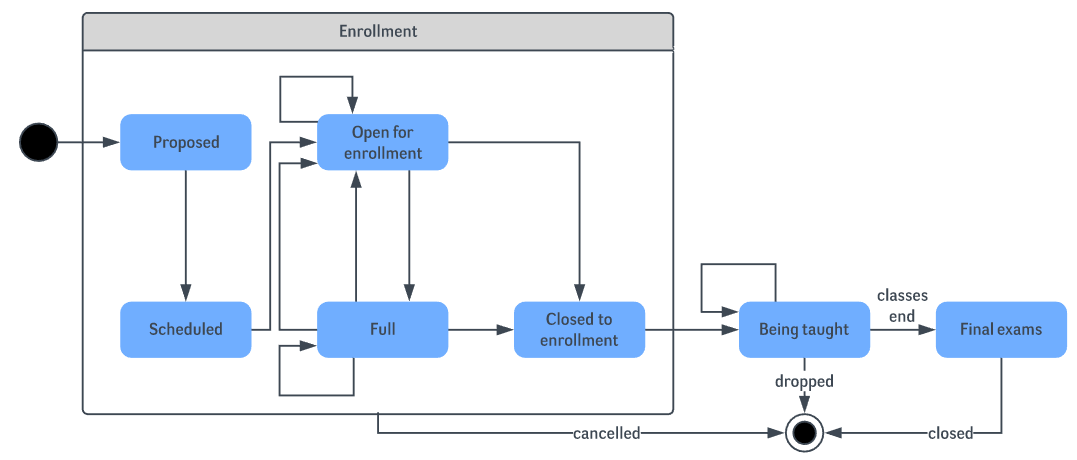
A state that has substates nested into it. See the university state diagram example below. “Enrollment” is the composite state in this example because it encompasses various substates in the enrollment process.
Choice pseudostate
A diamond symbol that indicates a dynamic condition with branched potential results.

Event
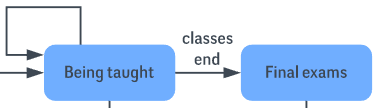
An instance that triggers a transition, labeled above the applicable transition arrow. In this case, “classes end” is the event that triggers the end of the “Being taught” state and the beginning of the “Final exams” state.
Exit point
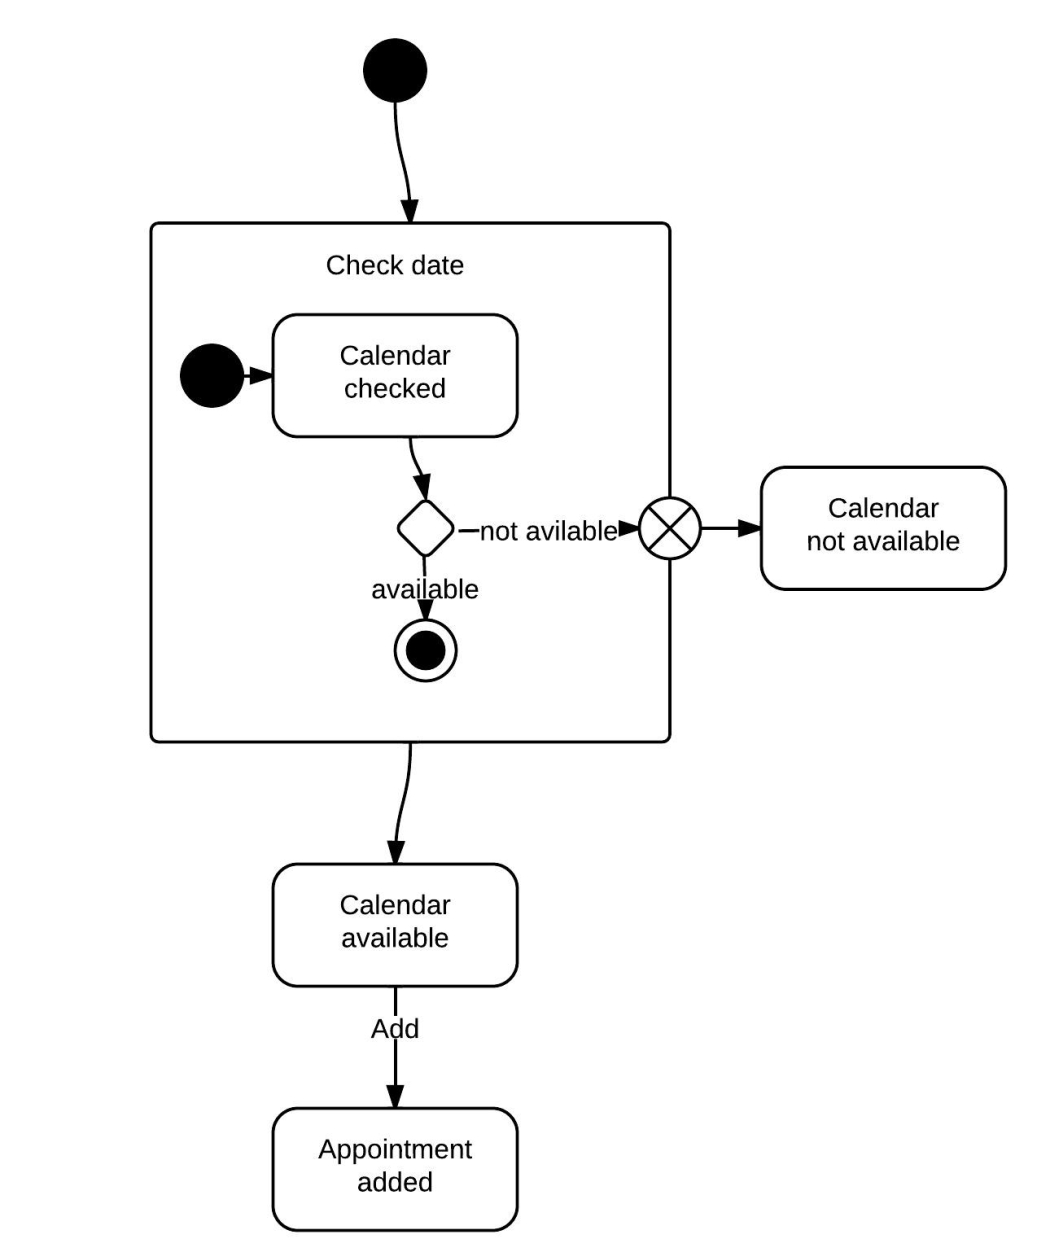
The point at which an object escapes the composite state or state machine, denoted by a circle with an X through it. The exit point is typically used if the process is not completed but has to be escaped for some error or other issue.

First state
A marker for the first state in the process, shown by a dark circle with a transition arrow.

Guard
A Boolean condition that allows or stops a transition, written above the transition arrow.
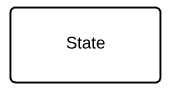
State
A rectangle with rounded corners that indicates the current nature of an object.
Substate
A state contained within a composite state's region. In the university state machine diagram found below, “Open for enrollment” is a substate in the larger “Enrollment” composite state.
Terminator
A circle with a dot in it that indicates that a process is terminated.

Transition
An arrow running from one state to another that indicates a changing state.

Transitional behavior
A behavior that results when a state transitions, written above the transition arrow.
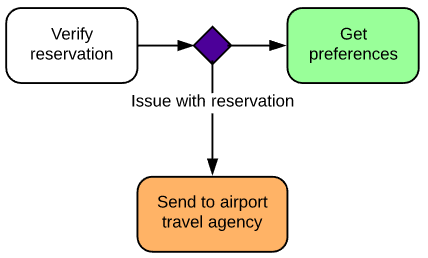
Trigger
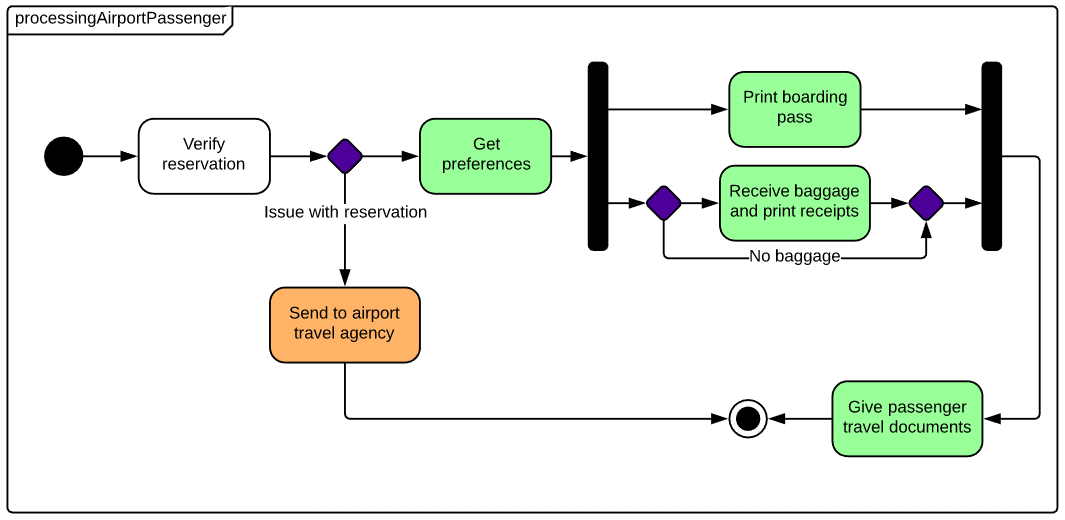
A type of message that actively moves an object from state to state, written above the transition arrow. In this example, “Issue with reservation” is the trigger that would send the person to the airport travel agency instead of the next step in the process.
State diagram examples
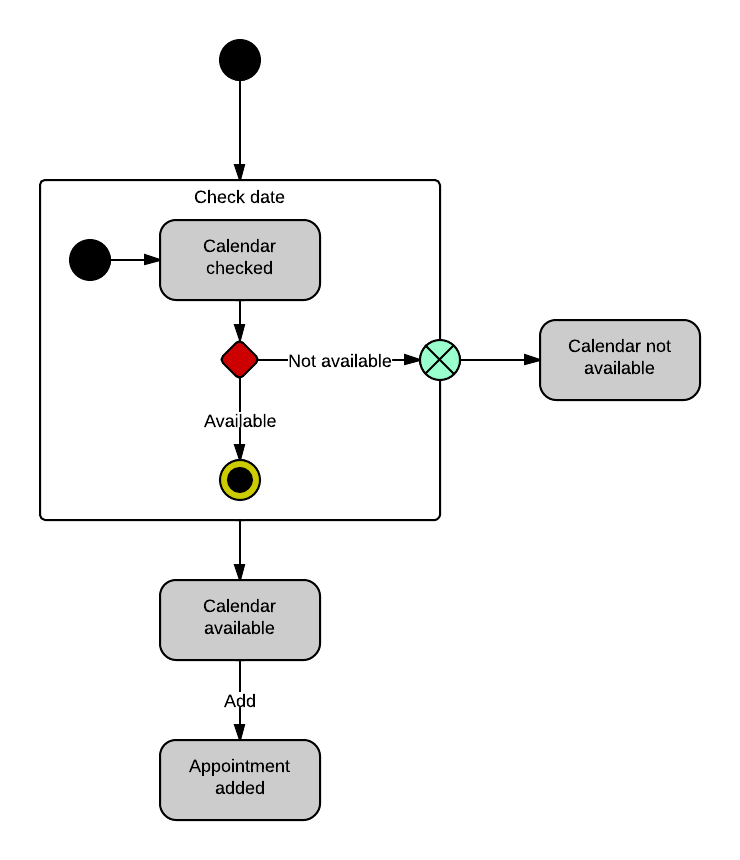
This state machine diagram example shows the process by which a person sets an appointment on their calendar. In the “Check date” composite state, the system checks the calendar for availability in a few different substates. If the time is not available on the calendar, the process will be escaped. If the calendar shows availability, however, the appointment will be added to the calendar.
University state diagram example
This state diagram shows the process of enrollment and classes at a university. The composite state “Enrollment” is made up of various substates that will lead students through the enrollment process. Once the student has enrolled, they will proceed to “Being taught” and finally to “Final exams.”
Airport check-in state diagram example
The following example simplifies the steps required to check in at an airport. For airlines, a state diagram can help to streamline processes and eliminate unnecessary steps.
How to make a state machine diagram in UML
State machine diagrams, commonly known as state diagrams, are a useful way of visualizing the various states that exist within a process. State diagrams can help administrators identify unnecessary steps in a process and streamline processes to improve the customer experience.
1. Get started with Lucidchart
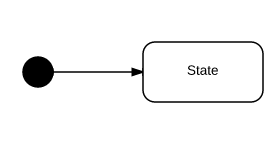
To create your own state machine diagrams, sign up for a free Lucidchart account. After signing up, open a blank document and enable the UML shape libraries. Click on "Shapes" in the upper-left corner of your window and check “UML.” The UML shape libraries will then appear on the left side of your window. Scroll down for the state diagram library and drag out a black circle to start the diagram. This circle indicates the initial state.
2. Identify components
Identify what the purpose of your diagram is and what elements you’ll describe with it. To help you determine the purpose, here are some of the main applications of a state diagram:
-
Portraying the movement of an object from state to state.
-
Showing how event-driven objects work in reactive systems.
-
Examining how use case sequences can be applied to a business scenario.
-
Providing an overview of a complex state machine or series of state machines.
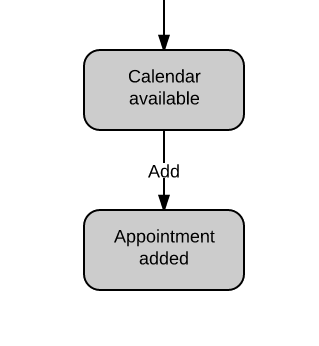
States and transitions are the main elements of a state diagram. Make a list of all the states you need to include in your diagram—consider every state the user will experience as the process continues, and then think about the transitions and events that lead users to experience that state. For example, in this snippet of a calendar state diagram below, an appointment must be added to the calendar before the “Appointment added” state can be realized.
3. Add shapes
Drag your mouse from one of the red dots that appear when you hover over the starting circle to create a transition arrow, a shape which leads to a change in states and points in the direction of the process flow. Once you create your arrow, the editor will automatically prompt you to choose a new shape to connect with it. Choose the state shape, a rectangle with rounded corners.
Label shapes
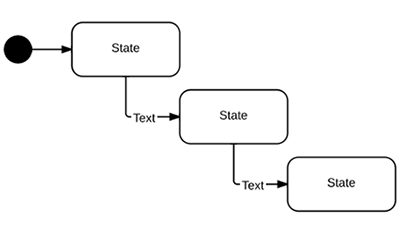
Next, simply click and type to label your state. To create a message on your transition arrow, double-click the line where you want to add text. For events and triggers, you can also drag out a text box directly above your transition arrow.
Add choices
If you need to express multiple options for your transitions, choose the diamond shape to indicate a pseudostate. You can draw out multiple transition arrows from this shape.

Complete the diagram
When your state diagram (or in more complex diagrams, one of your state machines) is finished, choose the bordered circle to indicate the final state.
Format the diagram
Lucidchart lets you customize every detail of your diagram for a professional, cohesive look. Once you've outlined the basics, it's easy to change the color, size, and direction of lines and shapes.
4. Publish, implement, and share
The real power behind state machine diagrams comes after you create the diagram, when you can collaborate and share with co-workers, classmates, etc. To download your document, go to File > Download As and choose the desired file type.
You can also add your final creation to any of your favorite apps, thanks to Lucidchart's integrations, opens in a new tab. Include diagrams in your Microsoft or G Suite documents or on company-wide shared platforms like Confluence.
To allow others to collaborate on your diagram, click on the orange "Share" button in the top-right corner of your window. Lucidchart users will be able to view the document and contribute to it, depending on the permissions that you set, and even non-users can view your state machine diagram.

Everything you need to make a diagram
Make a polished, professional diagram for free with Lucidchart. No matter what you have in mind, we have the tools you need to build it. Make an account and start diagramming today.
Sign up free