Key takeaways
-
Intelligent diagramming elevates static documents into interactive visual artifacts that serve as dynamic, single sources of truth that automatically update.
-
You can save time with intelligent diagramming features such as data linking, conditional formatting, and automation. AI capabilities also quickly generate and analyze complex workflows within a visual canvas.
-
Intelligent diagramming drives faster, data-backed decisions by making complex data more accessible and easier to surface key insights.
Intelligent diagramming does the heavy lifting of clearly communicating complex information for you. Instead of manually drawing static shapes, intelligent diagramming uses dynamic, interactive visuals that connect to external data sources and update in real time. Through features like conditional formatting, data linking, commenting, presentation mode, and automation, diagrams are elevated from static documents to impactful, long-lived artifacts that empower teams to see, align, and act.
We break down exactly what intelligent diagramming means and the features you should look for to take your diagrams to the next level.
The value of intelligent diagramming
Let’s break down the definition of intelligent diagramming further to better understand its value.
Elevates documents to impactful, long-lived artifacts
Static diagrams can help you visualize important information for a period of time, but intelligent diagrams can become impactful, long-lived artifacts that help your organization see where it’s been and where it’s going.
Intelligent diagrams are linked to data and update in real time, which means you and your team members can regularly refresh them to reflect the most current information rather than having to start from scratch. Stakeholders will be able to reference an intelligent diagram as a single source of truth rather than sift through various versions. And, documenting your processes with dynamic, up-to-date diagrams is a fundamental aspect of preparing for AI transformation.
A more intelligent way to diagram
Intelligent diagramming is a smarter way to diagram because, with automation and data linking functionality, it cuts out a lot of the need for manual work on your end. Diagramming should bring immediate value to your team—it shouldn’t become a time sink that puts off meaningful work. Teams that incorporate intelligent diagramming into their workflows save time and benefit from contextual clarity they wouldn’t have otherwise, especially if they use AI capabilities to generate and analyze complex documentation quickly
The diagrams are more intelligent
The diagrams themselves are also more intelligent. With data linking, real-time collaboration capabilities, conditional formatting functionality, and more, intelligent diagrams are smart tools that provide insight into much more than just the steps of a process. For example, they can reveal roadblocks, inefficiencies, dependencies, or other key considerations.
Intelligent diagrams become comprehensive sources of information that can be as simple or complex as you need. In many cases, they can be used to communicate the same information you would get from a meeting (or a couple of meetings), enhancing alignment and decision-making.
Intelligent diagramming features
If you’re interested in intelligent diagramming, what kind of features should you be looking for in diagramming options? Lucid has been building Lucidchart as an intelligent diagramming application for years, with smart features that help you quickly create diagrams and communicate complex information. Lucid’s intelligent diagramming solution includes features such as:
-
AI capabilities
-
Integrations
-
Conditional formatting
-
Assisted layout
-
Data linking
-
Smart containers
-
Presentation mode
-
Comments and tasks
-
Dynamic shapes
-
UML functionality
-
ERD functionality
AI capabilities
AI capabilities transform intelligent diagramming by turning raw data, rough sketches, or text prompts into comprehensive visuals within seconds. By using AI for your diagrams, you can save time on manually adding shapes and lines and enhance alignment, making your diagrams clearer for non-technical users.
You can use AI to:
-
Generate diagrams, including ERDs, flowcharts, and mind maps, from a prompt. For example, with Lucid’s AI capabilities, you can use Lucid AI to generate diagrams and iterate faster than ever.
-
Interact with documents without leaving your preferred AI interface by using an MCP server, which acts as the bridge between intelligent diagrams and your favorite AI tools. MCP servers are secure connection points that combine intelligence with operational power.
-
Enhance decision-making by using AI to brainstorm, sort and summarize ideas that you put on a visual board, and apply conditional formatting rules.
-
Create process diagrams from a screen recording with a tool like Lucid’s Process Capture. Simply record as you walk through a workflow, review your recording, and Process Capture generates a diagram you can refine on, as well as a written standard operating procedure.
-
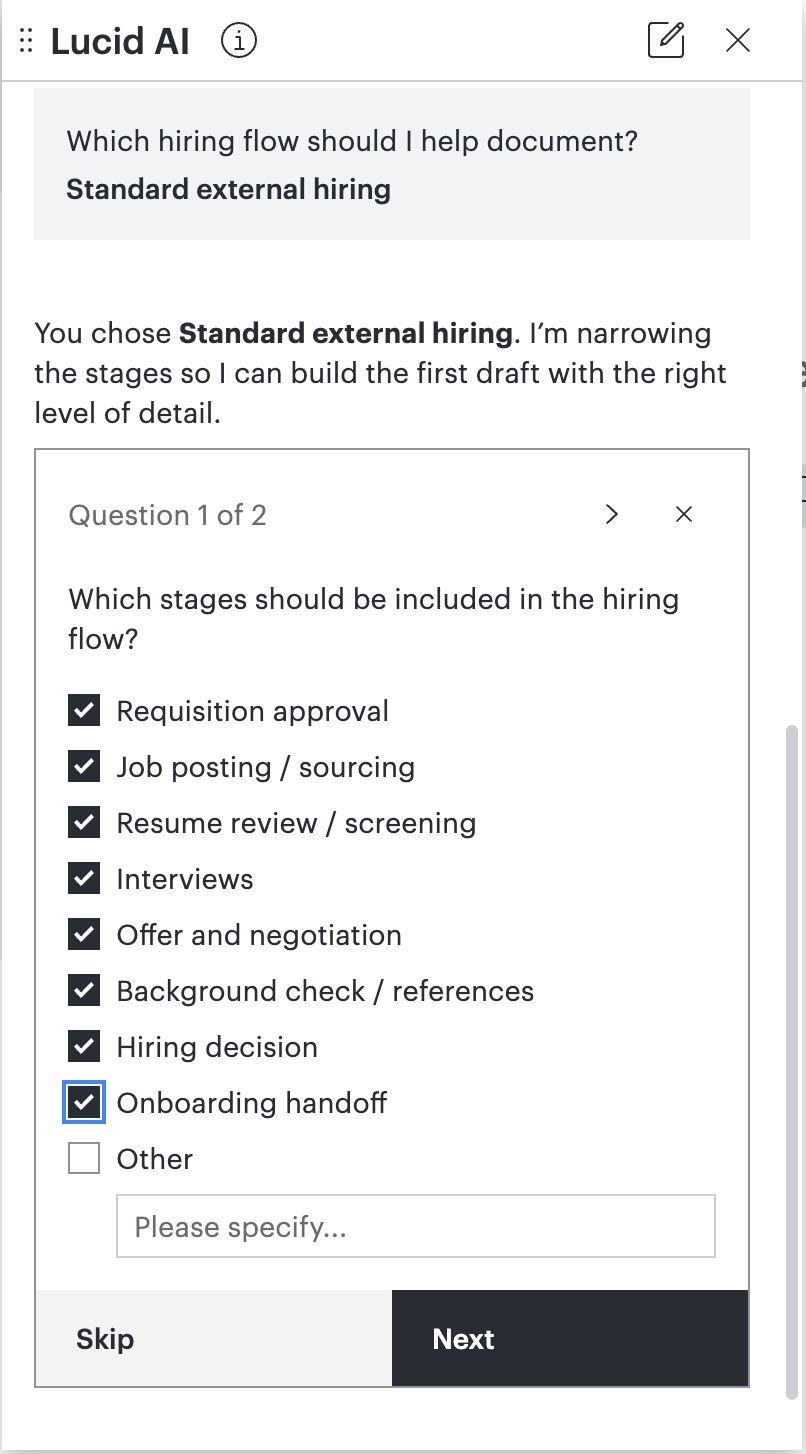
Build and refine process diagrams with Lucid’s Process Agent, a powerful, interactive tool that essentially acts as an AI coworker. The Process Agent generates an initial draft of a process diagram and then asks discovery questions to capture all the context needed to complete it, defining triggers, owners, and specific steps.
Integrations
Intelligent diagramming doesn't happen in isolation. To act as a true single source of truth, an intelligent diagram should connect directly to the tools your team relies on every day. By integrating diagramming into your broader tech stack, you eliminate context switching, automate data flow, and ensure living documentation is accessible right where work gets done.
Key integration capabilities that power intelligent diagramming include:
-
Enterprise architecture and data integrations with industry-leading apps such as SAP LeanIX and Ardoq to uncover insights and visualize cross-functional relationships across a business’s technology landscape. Integrate diagrams with Salesforce to import data and create dynamic account maps for sales teams.
-
External embed integrations, so you can embed your diagrams into other applications and keep everything on the same page. For example, embed your Lucid diagrams into Google Workspace, Microsoft Word, and Jira to increase clarity and enhance communication across apps.
-
AI-powered integrations, which connect your diagrams to tools such as Microsoft Copilot and Slack, to quickly retrieve and receive AI-generated summaries of your documentation.
Conditional formatting
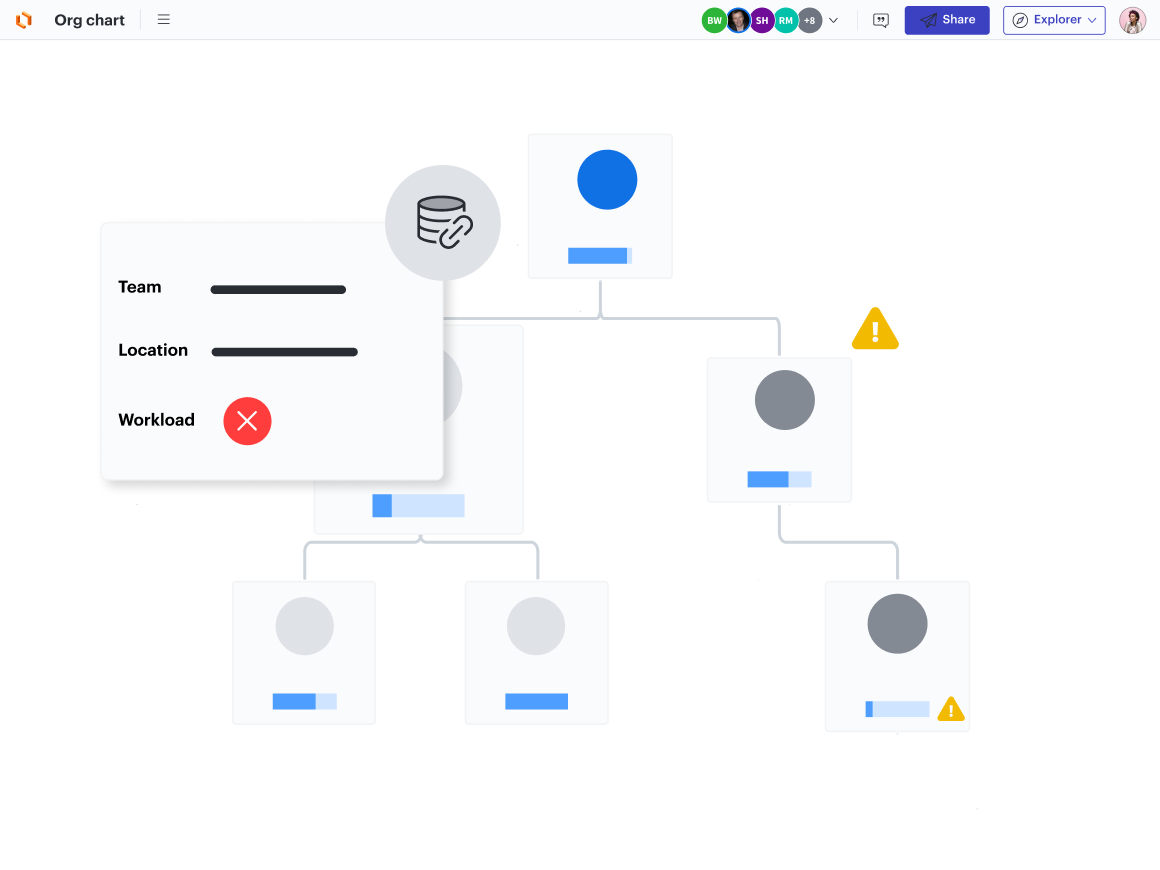
Conditional formatting allows you to highlight important information and visually alerts you to items that need attention. Conditional formatting rules allow you to evaluate all the shapes in your diagram for certain criteria and mark those that fit. You can even use Lucid AI to create new rules or set up specific rules.
For example, if you were creating an org chart, you could set a rule to highlight employees whose locations are not filled out, so you can see this instantly when looking at the chart, rather than manually checking each person’s information.
Assisted layout
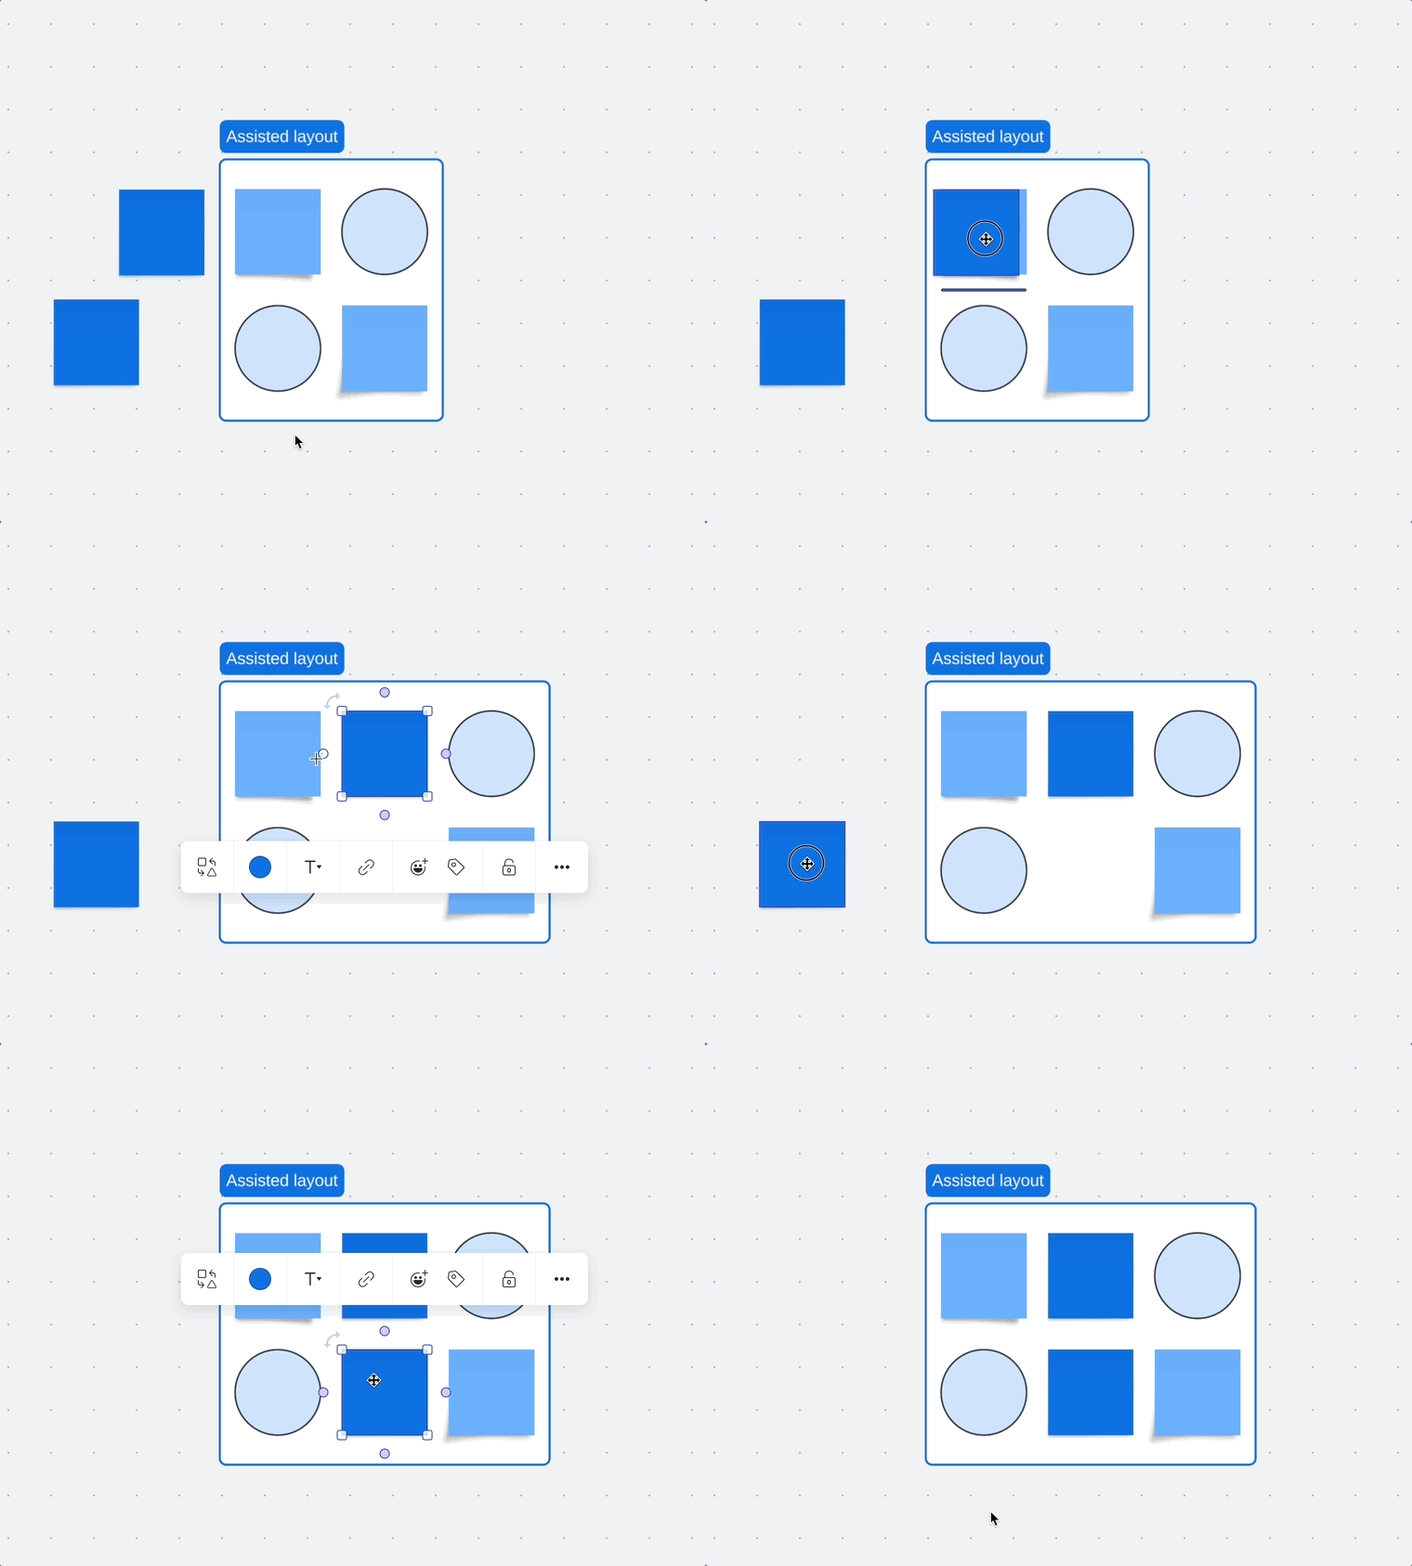
To polish your diagram further, Lucid offers assisted layout, a set of features that intuitively arranges shapes and lines automatically so your document looks professional and polished without the need for manual tweaking:
-
Line routing logic automatically finds the best route for a line to take between two shapes, so there isn’t any overlap and the connections are clear.
-
Shape-swapping capabilities seamlessly allow shapes to be swapped out without disrupting line flows. Simply drag a shape to the desired spot, and it will swap places with the shape that’s there.
-
Canvas spacing allows you to customize how far apart you want shapes to be. Simply adjust one, and the other shapes in the diagram will follow.
-
Drop zones allow you to add shapes to the middle of a diagram. Simply drop them in, and the existing lines and shapes will adjust to spread equally around them.
-
Quick line cleanup spaces out lines for you, so you don’t have to manually adjust them to look polished.
Data linking
One of the main ways intelligent diagramming is different from regular diagramming is the ability to link diagrams to data. In this way, intelligent diagrams become powerful, interactive tools.
For example, if you have a data set in Excel, you could link it to an intelligent diagram, and that diagram could be refreshed as often as needed to reflect the current state of the data set—all without creating a new diagram or re-linking the data.
Beyond data linking and data refresh, the best intelligent diagramming solutions also offer:
-
Data overlay: The ability to merge and transfer data between diagrams
-
Data replace: The ability to change out data sets that a diagram is linked to
Smart containers
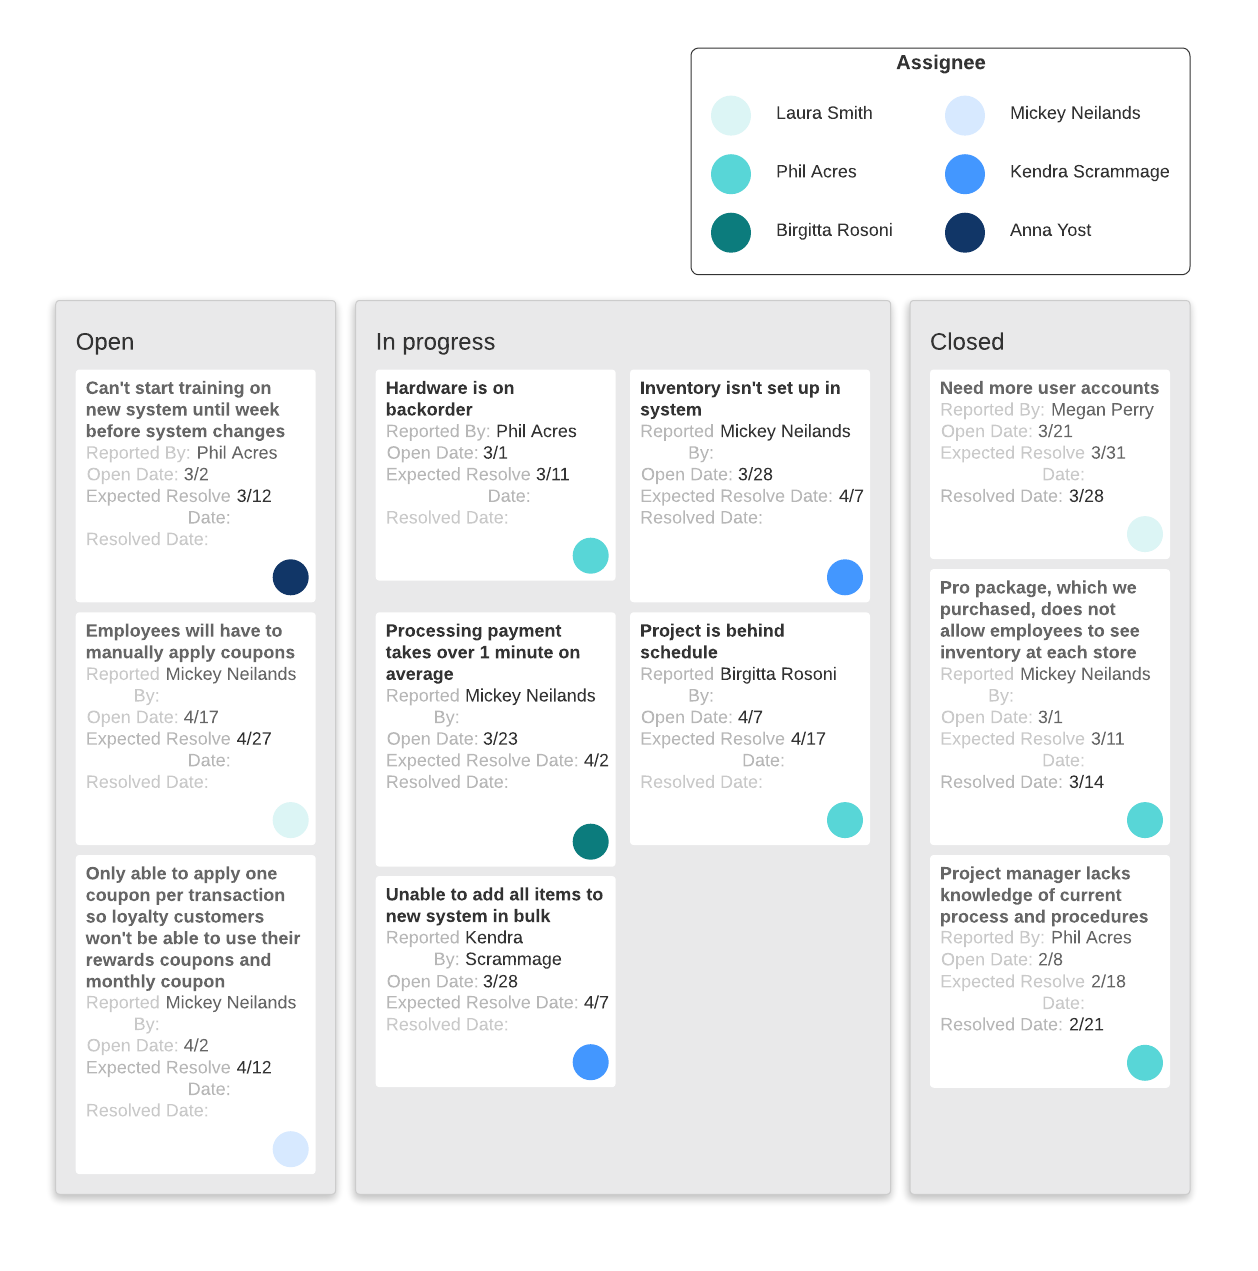
Smart containers allow you to group the data sets linked to your diagram by unique attributes rather than sifting through a spreadsheet to find the data you need.
For example, if you were using a spreadsheet to keep track of the progress of a project, you could import that data set into your diagram and set your smart containers to align with the “status” column of your spreadsheet. Within your diagram, your tasks would automatically be sorted into containers based on their statuses, such as “Not started,” “In progress,” and “Completed.”
Presentation mode
Presentation mode enables you to present your diagrams to stakeholders in a polished way from the app you created them in, instead of having to transfer information to a second software like Google Slides or Microsoft PowerPoint. Presentation mode falls under intelligent diagramming because it automates workflows and speeds up stakeholder buy-in.
Comments and tasks
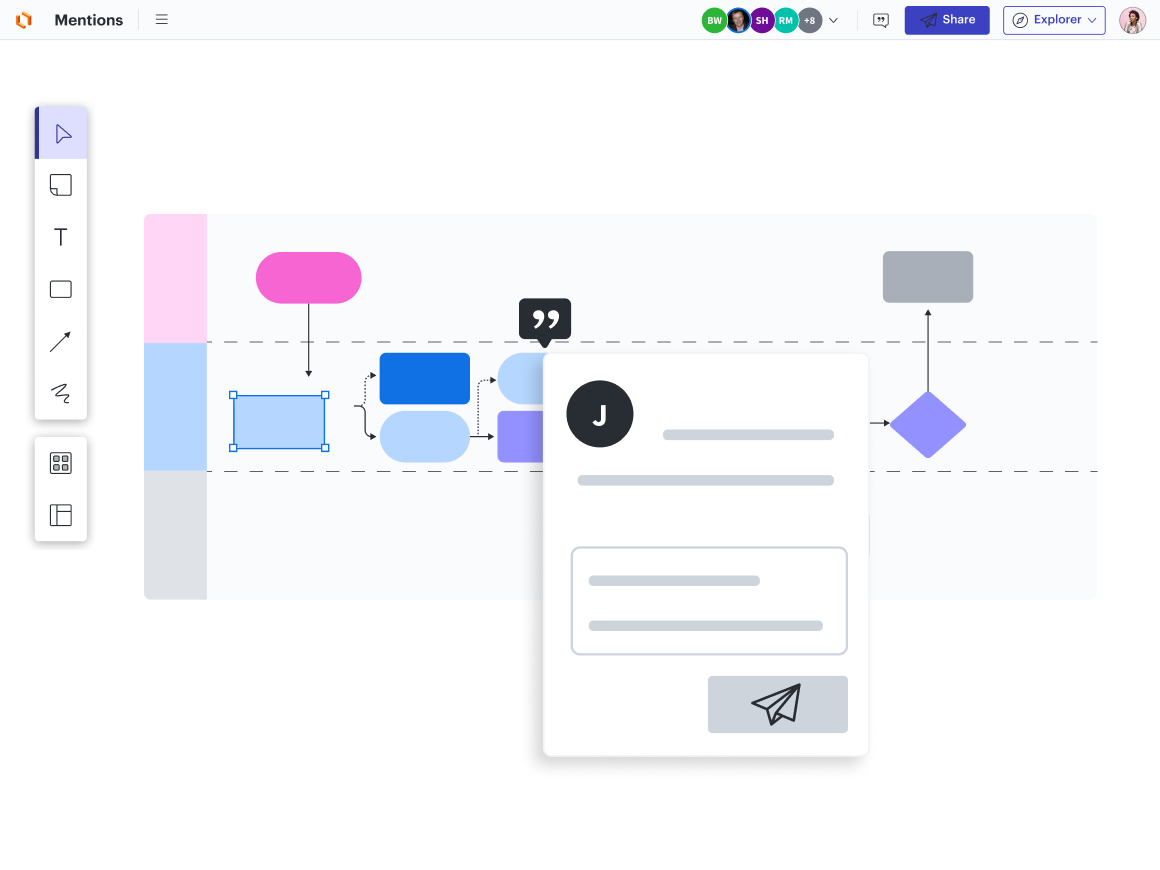
Add comments and assign collaborators to tasks all within your diagram. Real-time comments and tasks allow you to keep collaboration progressing without ever leaving the diagram you’re working on.
Similar to presentation mode, comments and tasks fall under intelligent diagramming because they automate workflows and approval processes.
Dynamic shapes
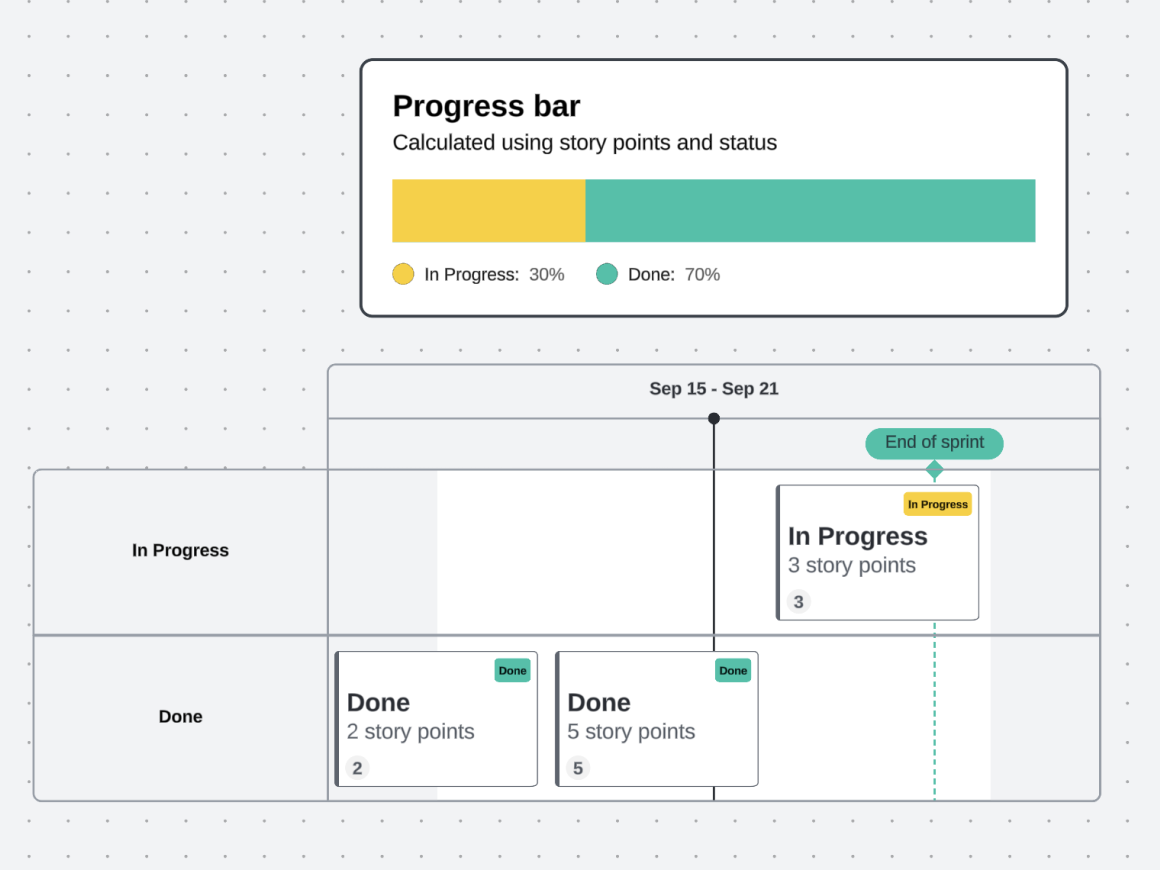
Dynamic shapes allow you to add static values or formulas to calculate or display information such as total progress, percentages, or ratings directly within a diagram.
For example, you could create a dashboard with dynamic shapes to show a data set visually rather than in a spreadsheet.
UML functionality
A Unified Modeling Language (UML) shape library includes the components needed to create various types of structural and behavioral diagrams with UML markup—such as class, deployment, sequence, and use case diagrams—with just a few clicks.
ERD functionality
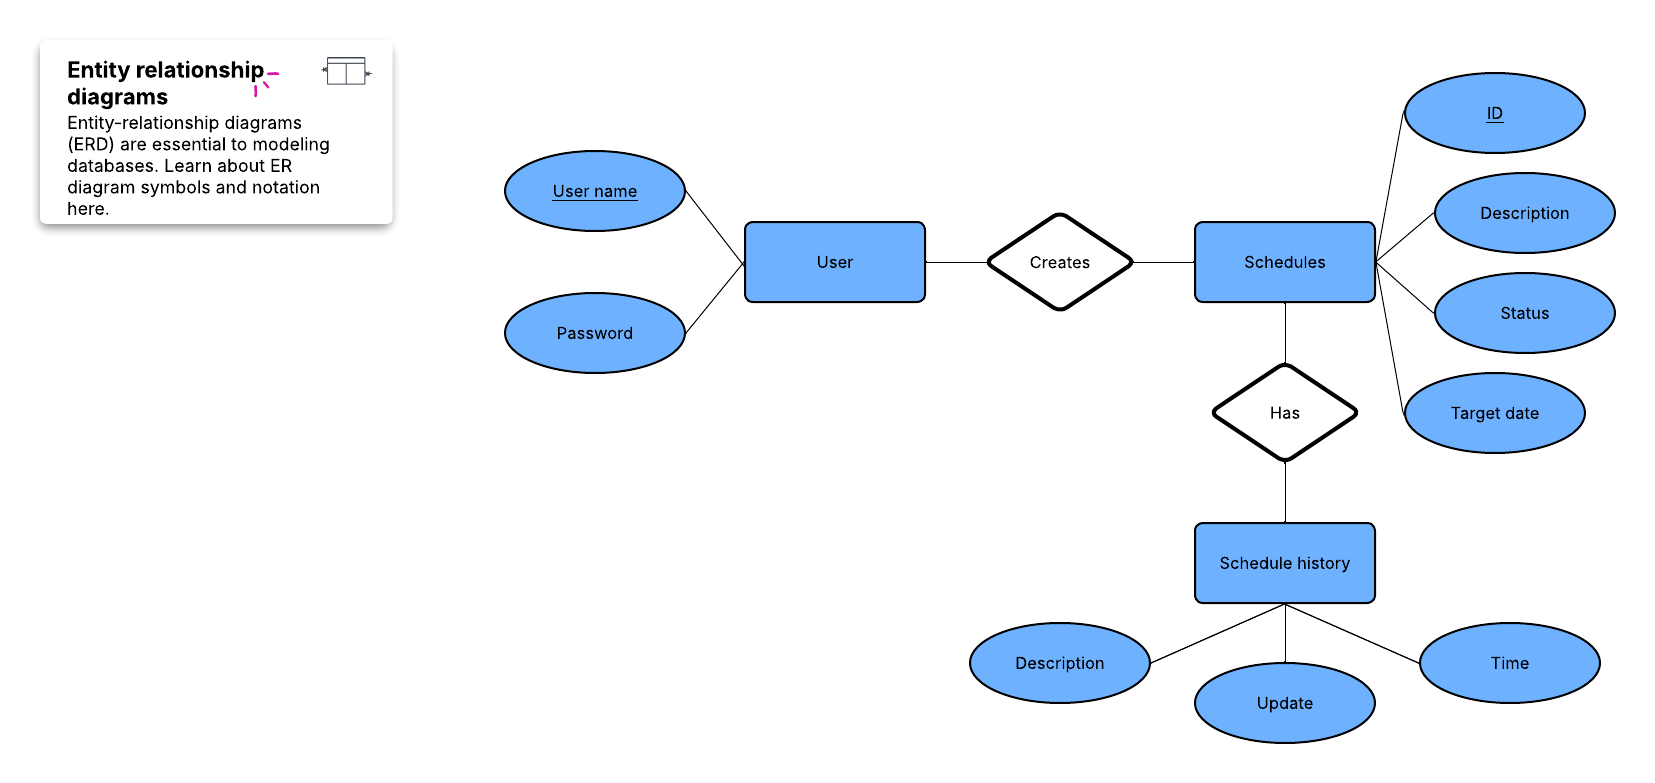
Create Entity Relationship diagrams (ERDs) with customized text, styling, and relationships between fields. Automatically generate database tables and schemas using SQL import features.
What Lucid brings to the table
Our goal is to help organizations build the future by empowering teams to see, align, and act. Your diagramming application shouldn’t be a point solution for creating visuals—it should help your team see opportunities and then act on those opportunities in a meaningful way.
Lucid includes all of the intelligent diagramming features we’ve outlined so far, plus virtual whiteboarding capabilities, more than 1,000 ready-to-use templates, integrations with industry-leading apps like Jira and Slack, and enhanced planning features such as capacity planning and scenario planning.
Check it out for yourself to see all that Lucid has to offer to boost alignment and visibility for your teams.

Try these features in Lucid
Try now